
 Saludos amigos, si sois unos fieles seguidores de la serie sobre En Busca Del Dashboard Perfecto usando Telegraf, Grafana e InfluxDB, este post os interesa.
Llegados a este punto, me imagino que tenéis todo funcionando, varios dashboards y cientos de equipos enviando información, lo cuál es un gran paso y os felicito.
Hoy vengo a contaros algo importante, tenemos que mantener actualizados estos componentes, como cualquier otro software, en cada versión se solucionan bugs y en algunas ocasiones incluso brechas de seguridad. ¡Vamos allá!
Actualizando Grafana a la última versión disponible 6.3.x
Antes de actualizar a la última versión, comprobaremos la versión en la que nos encontramos, desde CLI:
grafana-server -v
También desde la propia consola de Grafana, si miramos abajo del todo encontraremos la versión exacta:
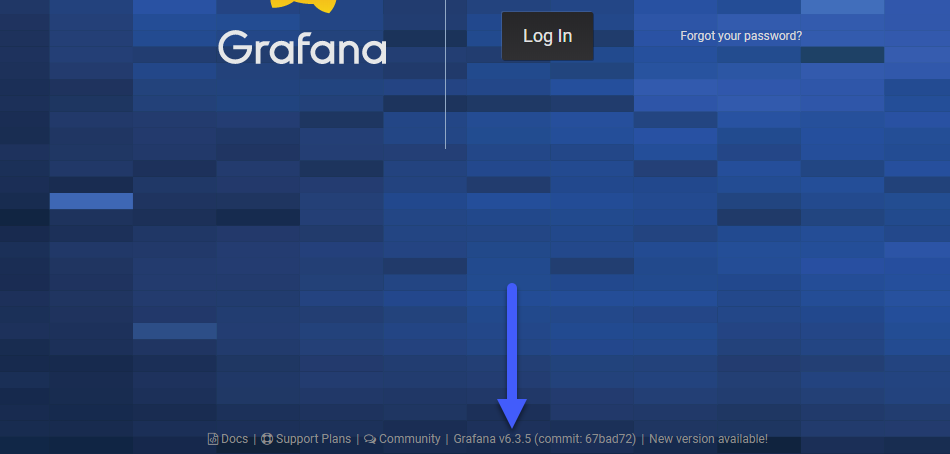 Vemos que no estoy en la última Release, que podremos comprobar cuál es aquí, con lo que si hubiéramos instalado Grafana mediante repository, tan sencillo como:
Ubuntu o Debian
sudo apt-get update && sudo apt-get upgrade
CentOS o RHEL
sudo yum update && sudo yum upgrade
Si tuvierais instalado Grafana como paquete individual, como es mi caso, tendremos que primero detener el servicio de Grafana:
service grafana-server stop
Y descargar e instalar la nueva versión, en mi caso Ubuntu:
wget https://dl.grafana.com/oss/release/grafana_6.3.6_amd64.deb
sudo dpkg -i grafana_6.3.6_amd64.deb
Este comando se encarga de reiniciar el servicio, con lo que ya estaríamos funcionando sin ningún problema:
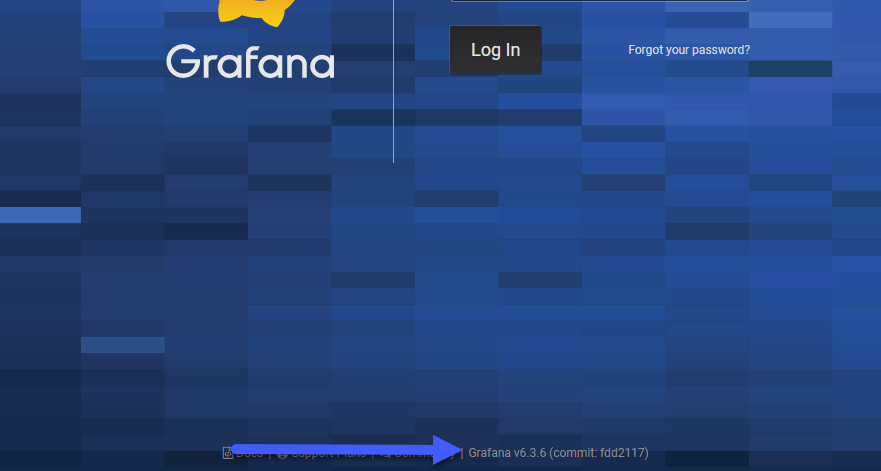 Muchas novedades en cada versión de Grafana 6.3.x, os las dejo todas resumidas aquí:
6.3.6 (2019-09-23)
Features / Enhancements
Bug Fixes
- Database: Rewrite system statistics query to perform better. #19178 17, @papagian 3
- Explore: Fixes error when switching from prometheus to loki data sources. #18599 2, @kaydelaney 4
6.3.5 (2019-09-02)
Upgrades
- Build: Upgrade to go 1.12.9. #18638 26, @marcusolsson 3
Bug Fixes
- Dashboard: Fixes dashboards init failed loading error for dashboards with panel links that had missing properties. #18786 8, @torkelo 3
- Editor: Fixes issue where only entire lines were being copied. #18806, @kaydelaney 4
- Explore: Fixes query field layout in splitted view for Safari browsers. #18654 1, @hugohaggmark 4
- LDAP: multildap + ldap integration. #18588 23, @markelog 1
- Profile/UserAdmin: Fix for user agent parser crashes grafana-server on 32-bit builds. #18788 1, @marcusolsson 3
- Prometheus: Prevents panel editor crash when switching to Prometheus datasource. #18616 1, @hugohaggmark 4
- Prometheus: Changes brace-insertion behavior to be less annoying. #18698 3, @kaydelaney 4
6.3.4 (2019-08-29)
- Security: Urgent security patch release. Please read more in our blog 377
6.3.3 (2019-08-15)
Bug Fixes
- Annotations: Fix failing annotation query when time series query is cancelled. #18532 9, @dprokop 2
- Auth: Do not set SameSite cookie attribute if cookie_samesite is none. #18462 5, @papagian 3
- DataLinks: Apply scoped variables to data links correctly. #18454 3, @dprokop 2
- DataLinks: Respect timezone when displaying datapoint’s timestamp in graph context menu. #18461 4, @dprokop 2
- DataLinks: Use datapoint timestamp correctly when interpolating variables. #18459 2, @dprokop 2
- Explore: Fix loading error for empty queries. #18488 3, @davkal
- Graph: Fixes legend issue clicking on series line icon and issue with horizontal scrollbar being visible on windows. #18563 1, @torkelo 3
- Graphite: Avoid glob of single-value array variables . #18420 1, @gotjosh
- Prometheus: Fix queries with label_replace remove the $1 match when loading query editor. #18480 5, @hugohaggmark 4
- Prometheus: More consistently allows for multi-line queries in editor. #18362 4, @kaydelaney 4
- TimeSeries: Assume values are all numbers. #18540 15, @ryantxu
6.3.2 (2019-08-07)
Bug Fixes
- Gauge/BarGauge: Fixes issue with losts thresholds and issue loading Gauge with avg stat. #18375 15
6.3.1 (2019-08-07)
Bug Fixes
- PanelLinks: Fix crash issue Gauge & Bar Gauge for panels with panel links (drill down links). #18430 3
6.3.0 (2019-08-06)
Features / Enhancements
- OAuth: Do not set SameSite OAuth cookie if cookie_samesite is None. #18392 5, @papagian 3
Bug Fixes
Actualizando Telegraf a la última versión disponible 1.12.x
Nos sucede lo mismo con Telegraf, el agente que se encarga de recolectar información en todos los equipos donde lo tenemos instalado, es muy importante mantener ese agente al día con las actualizaciones, aquí podemos encontrar la versión actual.
Antes de instalar nada, comprobaremos la versión de Telegraf que estamos ejecutando con el siguiente comando:
telegraf --version
Si tuviéramos instalado telegraf desde el repositorio, con estos comando se actualizaría:
Ubuntu o Debian
sudo apt-get update && sudo apt-get upgrade
CentOS o RHEL
sudo yum update && sudo yum upgrade
Si tuvierais instalado Grafana como paquete individual, como es mi caso, tendremos que primero detener el servicio de Grafana:
service telegraf stop
Y descargar e instalar la nueva versión, en mi caso Ubuntu:
wget https://dl.influxdata.com/telegraf/releases/telegraf_1.12.2-1_amd64.deb
sudo dpkg -i telegraf_1.12.2-1_amd64.deb
Este comando se encarga de reiniciar el servicio, con lo que ya estaríamos funcionando sin ningún problema:
service telegraf status
â— telegraf.service - The plugin-driven server agent for reporting metrics into InfluxDB
Loaded: loaded (/lib/systemd/system/telegraf.service; enabled; vendor preset: enabled)
Active: active (running) since Sat 2019-09-28 09:01:44 CDT; 6s ago
Docs: https://github.com/influxdata/telegraf
Main PID: 31251 (telegraf)
CGroup: /system.slice/telegraf.service
└─31251 /usr/bin/telegraf -config /etc/telegraf/telegraf.conf -config-directory /etc/telegraf/telegraf.d
Sep 28 09:01:44 tig-monitor systemd[1]: Started The plugin-driven server agent for reporting metrics into InfluxDB.
Sep 28 09:01:44 tig-monitor telegraf[31251]: 2019-09-28T14:01:44Z I! Starting Telegraf 1.12.2
Sep 28 09:01:44 tig-monitor telegraf[31251]: 2019-09-28T14:01:44Z I! Loaded inputs: processes swap system cpu disk diskio kernel mem ipmi_sensor ping cpu disk net system
Sep 28 09:01:44 tig-monitor telegraf[31251]: 2019-09-28T14:01:44Z I! Loaded aggregators:
Sep 28 09:01:44 tig-monitor telegraf[31251]: 2019-09-28T14:01:44Z I! Loaded processors:
Sep 28 09:01:44 tig-monitor telegraf[31251]: 2019-09-28T14:01:44Z I! Loaded outputs: influxdb
Sep 28 09:01:44 tig-monitor telegraf[31251]: 2019-09-28T14:01:44Z I! Tags enabled: host=tig-monitor
Sep 28 09:01:44 tig-monitor telegraf[31251]: 2019-09-28T14:01:44Z I! [agent] Config: Interval:1m0s, Quiet:false, Hostname:"tig-monitor", Flush Interval:10s
Muchas novedades en cada versión de Telegraf 1.12.x, os las dejo todas resumidas aquí:
v1.12.2 [2019-09-24]
Bugfixes
- #6386: Fix detection of layout timestamps in csv and json parser.
- #6394: Fix parsing of BATTDATE in apcupsd input.
- #6398: Keep boolean values listed in json_string_fields.
- #6393: Disable Go plugin support in official builds.
- #6391: Fix path handling issues in cisco_telemetry_gnmi.
v1.12.1 [2019-09-10]
Bugfixes
- #6344: Fix depends on GLIBC_2.14 symbol version.
- #6329: Fix filecount for paths with trailing slash.
- #6331: Convert check state to an integer in icinga2 input.
- #6354: Fix could not mark message delivered error in kafka_consumer.
- #6362: Skip collection stats when disabled in mongodb input.
- #6366: Fix error reading closed response body on redirect in http_response.
- #6373: Fix apcupsd documentation to reflect plugin.
- #6375: Display retry log message only when retry after is received.
v1.12 [2019-09-03]
Release Notes
- The cluster health related fields in the elasticsearch input have been split out from the
elasticsearch_indicesmesasurement into the newelasticsearch_cluster_health_indicesmeasurement as they were originally combined by error.
New Inputs
- apcupsd – Contributed by @jonaz
- docker_log – Contributed by @prashanthjbabu
- fireboard – Contributed by @ronnocol
- logstash – Contributed by @lkmcs @dmitryilyin @arkady-emelyanov
- marklogic – Contributed by @influxdata
- openntpd – Contributed by @aromeyer
- uwsgi – Contributed by @blaggacao
New Parsers
- form_urlencoded – Contributed by @byonchev
New Processors
- date – Contributed by @influxdata
- pivot – Contributed by @influxdata
- tag_limit – Contributed by @memory
- unpivot – Contributed by @influxdata
New Outputs
- exec – Contributed by @Jaeyo
Features
- #5842: Improve performance of wavefront serializer.
- #5863: Allow regex processor to append tag values.
- #5997: Add starttime field to phpfpm input.
- #5998: Add cluster name tag to elasticsearch indices.
- #6006: Add support for interface field in http_response input plugin.
- #5996: Add container uptime_ns in docker input plugin.
- #6016: Add better user-facing errors for API timeouts in docker input.
- #6027: Add TLS mutal auth support to jti_openconfig_telemetry input.
- #6053: Add support for ES 7.x to elasticsearch output.
- #6062: Add basic auth to prometheus input plugin.
- #6064: Add node roles tag to elasticsearch input.
- #5572: Support floats in statsd percentiles.
- #6050: Add native Go ping method to ping input plugin.
- #6074: Resume from last known offset in tail inputwhen reloading Telegraf.
- #6111: Add improved support for Azure SQL Database to sqlserver input.
- #6079: Add extra attributes for NVMe devices to smart input.
- #6084: Add docker_devicemapper measurement to docker input plugin.
- #6122: Add basic auth support to elasticsearch input.
- #6102: Support string field glob matching in json parser.
- #6101: Update gjson to allow multipath syntax in json parser.
- #6144: Add support for collecting SQL Requests to identify waits and blocking to sqlserver input.
- #6105: Collect k8s endpoints, ingress, and services in kube_inventory plugin.
- #6129: Add support for field/tag keys to strings processor.
- #6143: Add certificate verification status to x509_cert input.
- #6163: Support percentage value parsing in redis input.
- #6024: Load external Go plugins from –plugin-directory.
- #6184: Add ability to exclude db/bucket tag from influxdb outputs.
- #6137: Gather per collections stats in mongodb input plugin.
- #6195: Add TLS & credentials configuration for nats_consumer input plugin.
- #6194: Add support for enterprise repos to github plugin.
- #6060: Add Indices stats to elasticsearch input.
- #6189: Add left function to string processor.
- #6049: Add grace period for metrics late for aggregation.
- #4435: Add diff and non_negative_diff to basicstats aggregator.
- #6201: Add device tags to smart_attributes.
- #5719: Collect framework_offers and allocator metrics in mesos input.
- #6216: Add telegraf and go version to the internal input plugin.
- #6214: Update the number of logical CPUs dynamically in system plugin.
- #6259: Add darwin (macOS) builds to the release.
- #6241: Add configurable timeout setting to smart input.
- #6249: Add memory_usage field to procstat input plugin.
- #5971: Add support for custom attributes to vsphere input.
- #5926: Add cmdstat metrics to redis input.
- #6261: Add content_length metric to http_response input plugin.
- #6257: Add database_tag option to influxdb_listener to add database from query string.
- #6246: Add capability to limit TLS versions and cipher suites.
- #6266: Add topic_tag option to mqtt_consumer.
- #6207: Add ability to label inputs for logging.
- #6300: Add TLS support to nginx_plus, nginx_plus_api and nginx_vts.
Bugfixes
- #5692: Fix sensor read error stops reporting of all sensors in temp input.
- #4356: Fix double pct replacement in sysstat input.
- #6004: Fix race in master node detection in elasticsearch input.
- #6100: Fix SSPI authentication not working in sqlserver input.
- #6142: Fix memory error panic in mqtt input.
- #6136: Support Kafka 2.3.0 consumer groups.
- #6232: Fix persistent session in mqtt_consumer.
- #6235: Fix finder inconsistencies in vsphere input.
- #6138: Fix parsing multiple metrics on the first line of tailed file.
- #2526: Send TERM to exec processes before sending KILL signal.
- #5326: Query oplog only when connected to a replica set.
- #6317: Use environment variables to locate Program Files on Windows.
Leave a Reply