
 Saludos amigos, os he contado en numerosas ocasiones cómo desplegar vuestros propios sistemas de monitorización usando Grafana, InfluxDB y Telegraf, pero nunca he abordado el tema de seguridad, al menos lo más básico, servir Grafana usando SSL, con lo que en esta entrada vamos a ver cómo configurar Grafana para que sea servido usando SSL, además de usar Let’s Encrypt para que no nos cueste ni un céntimo.
Instalar Let’s Encrypt Certbot
Let’s Encrypt es maravilloso, recordar que nos permite solicitar certificados SSL de manera gratuita y válidos por hasta 3 meses, con opciones sencillas de renovación que cubriremos más tarde.
El primero paso será añadir el repositorio de certbot al sistema con el siguiente comando:
sudo add-apt-repository ppa:certbot/certbot
Esto nos mostrará un output similar al siguiente:
 This is the PPA for packages prepared by Debian Let's Encrypt Team and backported for Ubuntu(s).
 More info: https://launchpad.net/~certbot/+archive/ubuntu/certbot
Press [ENTER] to continue or ctrl-c to cancel adding it

gpg: keyring `/tmp/tmp982fvdb1/secring.gpg' created
gpg: keyring `/tmp/tmp982fvdb1/pubring.gpg' created
gpg: requesting key 75BCA694 from hkp server keyserver.ubuntu.com
gpg: /tmp/tmp982fvdb1/trustdb.gpg: trustdb created
gpg: key 75BCA694: public key "Launchpad PPA for certbot" imported
gpg: Total number processed: 1
gpg:               imported: 1  (RSA: 1)
OK
Realizaremos un apt-get update, además de instalar certbot:
sudo apt-get update
sudo apt-get install certbot
Y ya tendremos todo listo para solicitar nuestro SSL, tengo en cuenta que el server tiene acceso a Internet, que el dominio que estáis solicitando responde un DNS público a la IP de salida del server de Grafana, y que el puerto 80 está escuchando en el server de Grafana para poder completar la petición:
sudo certbot -d veeamtech.ddns.net
Este comando nos mostrará el siguiente menú con preguntas, que tendremos que completar esta única vez:
Saving debug log to /var/log/letsencrypt/letsencrypt.log
Plugins selected: Authenticator nginx, Installer nginx
Enter email address (used for urgent renewal and security notices) (Enter 'c' to
cancel): [email protected]
Starting new HTTPS connection (1): acme-v02.api.letsencrypt.org

- - - - - - - - - - - - - - - - - - - - - - - - - - - - - - - - - - - - - - - -
Please read the Terms of Service at
https://letsencrypt.org/documents/LE-SA-v1.2-November-15-2017.pdf. You must
agree in order to register with the ACME server at
https://acme-v02.api.letsencrypt.org/directory
- - - - - - - - - - - - - - - - - - - - - - - - - - - - - - - - - - - - - - - -
(A)gree/(C)ancel: A

- - - - - - - - - - - - - - - - - - - - - - - - - - - - - - - - - - - - - - - -
Would you be willing to share your email address with the Electronic Frontier
Foundation, a founding partner of the Let's Encrypt project and the non-profit
organization that develops Certbot? We'd like to send you email about our work
encrypting the web, EFF news, campaigns, and ways to support digital freedom.
- - - - - - - - - - - - - - - - - - - - - - - - - - - - - - - - - - - - - - - -
(Y)es/(N)o: Y
Ya una vez contestado todo, podremos ver el proceso de petición e instalación del SSL en local:
Starting new HTTPS connection (1): supporters.eff.org
Obtaining a new certificate
Performing the following challenges:
http-01 challenge for grafana.jorgedelacruz.es
http-01 challenge for veeamtech.ddns.net
Waiting for verification...
Cleaning up challenges
Resetting dropped connection: acme-v02.api.letsencrypt.org
Deploying Certificate to VirtualHost /etc/nginx/sites-enabled/default

Please choose whether or not to redirect HTTP traffic to HTTPS, removing HTTP access.
- - - - - - - - - - - - - - - - - - - - - - - - - - - - - - - - - - - - - - - -
1: No redirect - Make no further changes to the webserver configuration.
2: Redirect - Make all requests redirect to secure HTTPS access. Choose this for
new sites, or if you're confident your site works on HTTPS. You can undo this
change by editing your web server's configuration.
- - - - - - - - - - - - - - - - - - - - - - - - - - - - - - - - - - - - - - - -
Select the appropriate number [1-2] then [enter] (press 'c' to cancel): 1

- - - - - - - - - - - - - - - - - - - - - - - - - - - - - - - - - - - - - - - -
Congratulations! You have successfully enabled https://veeamtech.ddns.net

You should test your configuration at:
https://www.ssllabs.com/ssltest/analyze.html?d=veeamtech.ddns.net
- - - - - - - - - - - - - - - - - - - - - - - - - - - - - - - - - - - - - - - -

IMPORTANT NOTES:
 - Congratulations! Your certificate and chain have been saved at:
   /etc/letsencrypt/live/veeamtech.ddns.net/fullchain.pem
   Your key file has been saved at:
   /etc/letsencrypt/live/veeamtech.ddns.net/privkey.pem
   Your cert will expire on 2019-08-30. To obtain a new or tweaked
   version of this certificate in the future, simply run certbot again
   with the "certonly" option. To non-interactively renew *all* of
   your certificates, run "certbot renew"
 - If you like Certbot, please consider supporting our work by:

   Donating to ISRG / Let's Encrypt:   https://letsencrypt.org/donate
   Donating to EFF:                    https://eff.org/donate-le
Como podemos ver, ya tenemos los ficheros necesarios, cert.pem, fullchain.pem y privkey.pem en la ruta /etc/letsencrypt/live/TUDOMINIO/*, vamos a ver los privilegios, tamaño, etc:
ls -la /etc/letsencrypt/live/veeamtech.ddns.net/
total 12
drwxr-xr-x 2 root root 4096 Jun  1 14:12 .
drwx------ 3 root root 4096 Jun  1 14:12 ..
lrwxrwxrwx 1 root root   42 Jun  1 14:12 cert.pem -> ../../archive/veeamtech.ddns.net/cert1.pem
lrwxrwxrwx 1 root root   43 Jun  1 14:12 chain.pem -> ../../archive/veeamtech.ddns.net/chain1.pem
lrwxrwxrwx 1 root root   47 Jun  1 14:12 fullchain.pem -> ../../archive/veeamtech.ddns.net/fullchain1.pem
lrwxrwxrwx 1 root root   45 Jun  1 14:12 privkey.pem -> ../../archive/veeamtech.ddns.net/privkey1.pem
-rw-r--r-- 1 root root  692 Jun  1 14:12 README
¿Lo mejor de todo? Certbot de Let’s Encrypt se encargará de renovar estos certificados cada 90 días, ya que hay una tarea que se ejecuta dos veces por día para comprobar el estado del SSL, todo esto grátis, ¿qué más queremos?
Si quisieramos ver cómo se renueva, podemos ejecutar el siguiente comando:
sudo certbot renew --dry-run
Configuración de Grafana para forzar el tráfico por HTTPS/SSL
Ahora que ya tenemos nuestros ficheros listos, tendremos que editar el fichero de configuración de Grafana, que podemos encontrar aquí:
vi /etc/grafana/grafana.ini
Y editar lo siguiente, básicamente decirle que queremos usar https, el dominio que está esperando, enforce domain es opcional pero recomendable, y muy importante la ruta que he mencionado anteriormente a los ficheros de Let’s Encrypt:
#################################### Server ####################################
[server]
# Protocol (http or https)
protocol = https

# The http port  to use
;http_port = 3000

# The public facing domain name used to access grafana from a browser
domain = veeamtech.ddns.net

# Redirect to correct domain if host header does not match domain
# Prevents DNS rebinding attacks
enforce_domain = true

# https certs & key file
cert_file = /etc/letsencrypt/live/veeamtech.ddns.net/cert.pem
cert_key = /etc/letsencrypt/live/veeamtech.ddns.net/privkey.pem
Como pequeño truco, ya que el grupo de grafana en mi caso no tiene acceso a estos ficheros, he tenido que realizar lo siguiente:
chgrp -R grafana /etc/letsencrypt
chmod -R g=rX /etc/letsencrypt
sudo service grafana-server restart
Si no hicieramos esto, al arrancar Grafana nos mostraría el siguiente error:
t=2019-06-01T14:48:00-0500 lvl=eror msg="Stopped HTTPServer" logger=server reason="open /etc/letsencrypt/live/veeamtech.ddns.net/fullchain.pem: permission denied"
t=2019-06-01T14:48:00-0500 lvl=info msg="Stopped provisioningServiceImpl" logger=server reason="context canceled"
t=2019-06-01T14:48:00-0500 lvl=eror msg="Server shutdown" logger=server reason="open /etc/letsencrypt/live/veeamtech.ddns.net/fullchain.pem: permission denied"
Si os surge este problema, por favor revisar que el grupo con el que se ejecutar Grafana, en mi caso grafana, está añadido a la carpeta de Let’s Encrypt como os he mostrado.
Accediendo a Grafana de manera segura con HTTPS
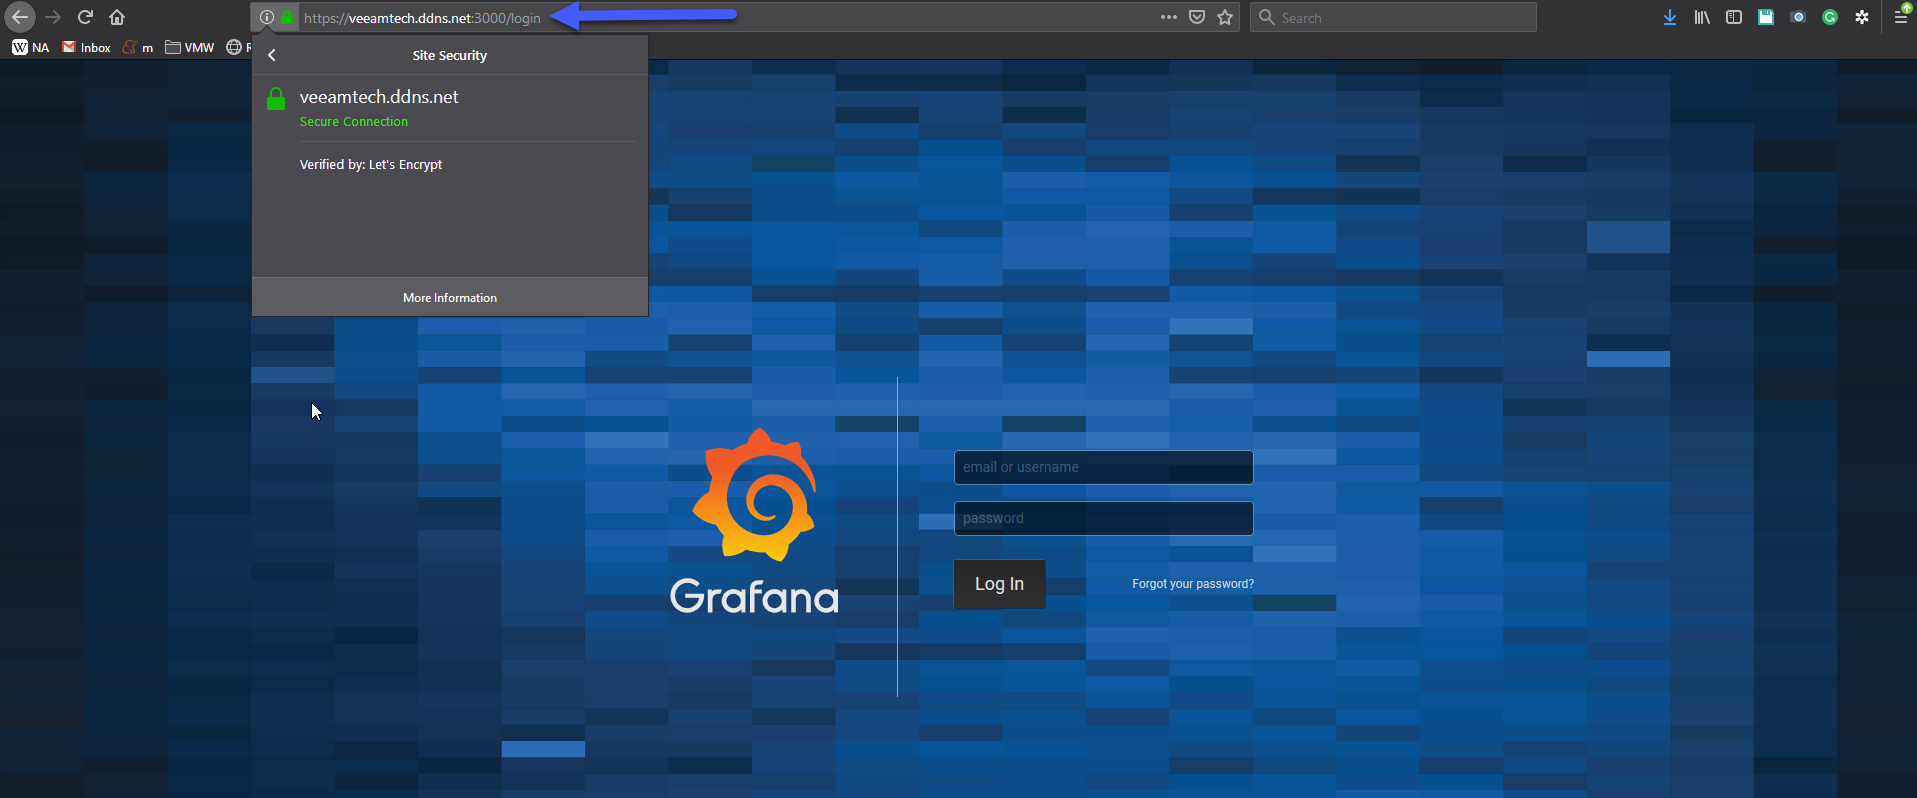
Ahora que ya tenemos todo preparado, configurado y todo funciona, vamos a acceder a nuestro FQDN con HTTPS delante y el puerto 3000, ya podremos ver el candado verde y nuestra conexión mediante SSL, ¡buen trabajo!
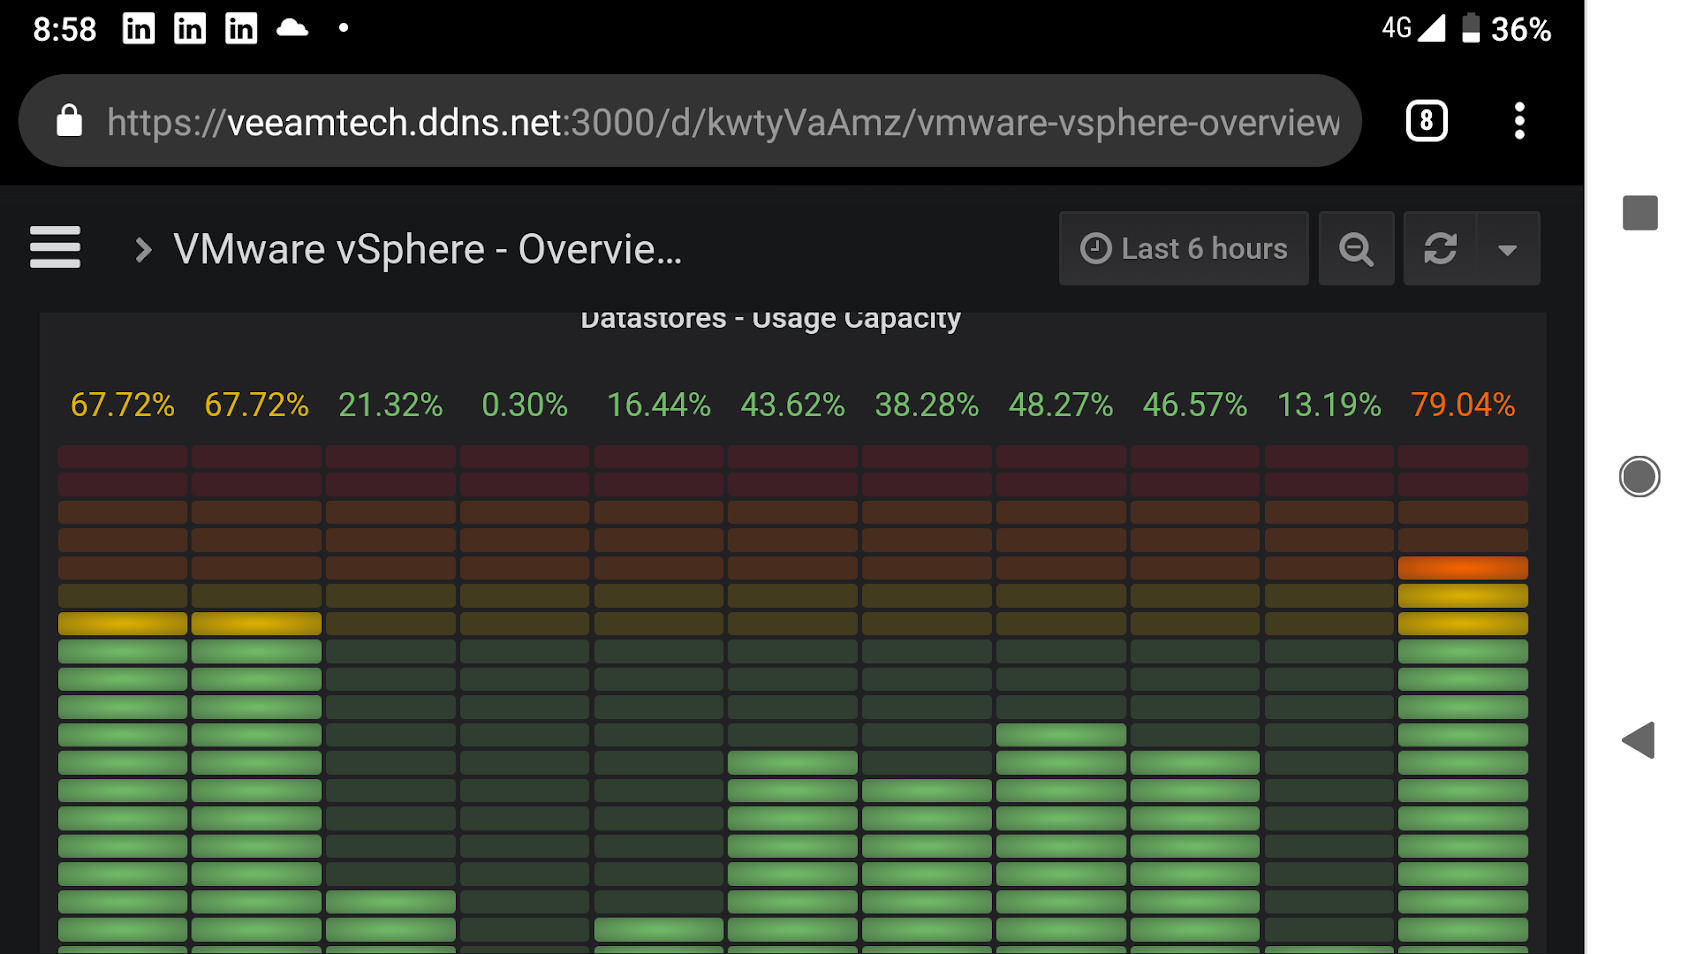
 He acedido desde mi móvil para ver que funciona todo bien incluso con 4G, y podemos ver que todo carga bien, sin notificaciones en el navegador, y todo se ve de maravilla:
  Os dejo todas las entradas sobre Grafana, por si os son de ayuda:
- En busca del Dashboard perfecto: InfluxDB, Telegraf y Grafana – Parte I (Instalando InfluxDB, Telegraf y Grafana)
- En busca del Dashboard perfecto: InfluxDB, Telegraf y Grafana – Parte II (Instalar agente Telegraf en Nodos remotos Linux)
- En busca del Dashboard perfecto: InfluxDB, Telegraf y Grafana – Parte III Integración con PRTG
- En busca del Dashboard perfecto: InfluxDB, Telegraf y Grafana – Parte IV (Instalar agente Telegraf en Nodos remotos Windows)
- En busca del Dashboard perfecto: InfluxDB, Telegraf y Grafana – Parte V (Activar inputs específicos, Red, MySQL/MariaDB, Nginx)
- En busca del Dashboard perfecto: InfluxDB, Telegraf y Grafana – Parte VI (Monitorizando Veeam)
- En busca del Dashboard perfecto: InfluxDB, Telegraf y Grafana – Parte VII (Monitorizar vSphere)
- En busca del Dashboard perfecto: InfluxDB, Telegraf y Grafana – Parte VIII (Monitorizando Veeam con Enterprise Manager)
- En busca del Dashboard perfecto: InfluxDB, Telegraf y Grafana – Parte IX (Monitorizando Zimbra Collaboration)
- En busca del Dashboard perfecto: InfluxDB, Telegraf y Grafana – Parte X (Grafana Plugins)
- En busca del Dashboard perfecto: InfluxDB, Telegraf y Grafana – Parte XI
- En busca del Dashboard perfecto: InfluxDB, Telegraf y Grafana – Parte XII – Plugin nativo de Telegraf para vSphere
- En busca del Dashboard perfecto: InfluxDB, Telegraf y Grafana – Parte XIII – Veeam Backup for Microsoft Office 365
- En busca del Dashboard perfecto: InfluxDB, Telegraf y Grafana – Parte XIV – Veeam Availability Console
- En busca del Dashboard perfecto: InfluxDB, Telegraf y Grafana – Parte XV – Monitorización IPMI de nuestros Hosts ESXi
puedes hacer algo parecido a lo que muestras en este manual, peroooooooooo para monitorizar proxmox?
Por si a alguien le ocurre lo mismo: cuando el certificado caduca y certbot realiza la renovación automática, hay que reiniciar el servidor de grafana para que cargue el nuevo certificado, de lo contrario el navegador mostrará un error de certificado expirado.
Muchas gracias por el comentario Guillermo!
Si yo siempre realizo el restart, tengo todo en un pequenyo script.
Saludos