
 Saludos amigos, retomo esta serie tan interesante sobre InfluxDB, Telegraf y Grafana, y hoy os quiero mostrar cómo instalar y configurar el agente de Telegraf para máquinas Windows.
Instalando el agente de Telegraf en Windows
Vamos a instalar telegraf desde una PowerShell con permisos de administrador. Podemos saber que versión de telegraf es la más reciente si miramos aquí:
En mi caso he usado la versión 1.27.3, pero como os digo mirar cual es más reciente. Estos comandos de Powershell nos ahorran tener que descargar y descomprimir de manera visual:
wget https://dl.influxdata.com/telegraf/releases/telegraf-1.27.3_windows_amd64.zip -UseBasicParsing -OutFile telegraf-1.27.3_windows_amd64.zip
Expand-Archive .\telegraf-1.27.3_windows_amd64.zip -DestinationPath 'C:\Program Files\InfluxData\telegraf\'
cd "C:\Program Files\InfluxData\telegraf"
mv .\telegraf-1.27.3\telegraf.* .
Eso ha instalado la última versión de telegraf, se ha movido a la ruta correcta, etc. Vamos a añadirlo ahora como Servicio de Windows:
.\telegraf.exe --service install --config "C:\Program Files\InfluxData\telegraf\telegraf.conf"
Pasemos a la parte de configuración, no hay mucho que hacer, sólo asegurarse de que el agente utiliza el nombre de host, la ruta del log es correcta, y nuestra configuración de output apunta a nuestro InfluxDB también. Por ejemplo, aquí está mi agente. la sección de logs y el output:
[agent]
  interval = "10s"
  round_interval = true

  metric_batch_size = 1000
  metric_buffer_limit = 10000
  collection_jitter = "0s"

  flush_interval = "10s"
  flush_jitter = "0s"

  precision = "0s"
  logtarget = "file"
  logfile = "C:/Program Files/InfluxData/telegraf/telegraf.log"

  hostname = "veeamone.jorgedelacruz.es"

  omit_hostname = false

[outputs.influxdb_v2]
   urls = ["https://YOURINFLUXDB:8086"]
   token = "YOUROWNTOKEN"
   organization = "NAMEOFYOURORG"
   bucket = "YOURBUCKET"
Y por último, al final del archivo, vamos a añadir la configuración para que monitorice CPU, RAM, Tráfico de Red, etc.:
[[inputs.win_perf_counters]]
[[inputs.win_perf_counters.object]]
   # Processor usage, alternative to native, reports on a per core.
   ObjectName = "Processor"
   Instances = ["*"]
   Counters = [
     "% Idle Time",
     "% Interrupt Time",
     "% Privileged Time",
     "% User Time",
     "% Processor Time",
     "% DPC Time",
   ]
   Measurement = "win_cpu"
   # Set to true to include _Total instance when querying for all (*).
   # IncludeTotal=false
   # Print out when the performance counter is missing from object, counter or instance.
   # WarnOnMissing = false
   # Gather raw values instead of formatted. Raw value is stored in the field name with the "_Raw" suffix, e.g. "Disk_Read_Bytes_sec_Raw".
   # UseRawValues = true

 [[inputs.win_perf_counters.object]]
   # Disk times and queues
   ObjectName = "LogicalDisk"
   Instances = ["*"]
   Counters = [
     "% Idle Time",
     "% Disk Time",
     "% Disk Read Time",
     "% Disk Write Time",
     "% User Time",
     "% Free Space",
     "Current Disk Queue Length",
     "Free Megabytes",
   ]
   Measurement = "win_disk"

 [[inputs.win_perf_counters.object]]
   ObjectName = "PhysicalDisk"
   Instances = ["*"]
   Counters = [
     "Disk Read Bytes/sec",
     "Disk Write Bytes/sec",
     "Current Disk Queue Length",
     "Disk Reads/sec",
     "Disk Writes/sec",
     "% Disk Time",
     "% Disk Read Time",
     "% Disk Write Time",
   ]
   Measurement = "win_diskio"

 [[inputs.win_perf_counters.object]]
   ObjectName = "Network Interface"
   Instances = ["*"]
   Counters = [
     "Bytes Received/sec",
     "Bytes Sent/sec",
     "Packets Received/sec",
     "Packets Sent/sec",
     "Packets Received Discarded",
     "Packets Outbound Discarded",
     "Packets Received Errors",
     "Packets Outbound Errors",
   ]
   Measurement = "win_net"


 [[inputs.win_perf_counters.object]]
   ObjectName = "System"
   Counters = [
     "Context Switches/sec",
     "System Calls/sec",
     "Processor Queue Length",
     "System Up Time",
   ]
   Instances = ["------"]
   Measurement = "win_system"

 [[inputs.win_perf_counters.object]]
   # Example counterPath where the Instance portion must be removed to get data back,
   # such as from the Memory object.
   ObjectName = "Memory"
   Counters = [
     "Available Bytes",
     "Cache Faults/sec",
     "Demand Zero Faults/sec",
     "Page Faults/sec",
     "Pages/sec",
     "Transition Faults/sec",
     "Pool Nonpaged Bytes",
     "Pool Paged Bytes",
     "Standby Cache Reserve Bytes",
     "Standby Cache Normal Priority Bytes",
     "Standby Cache Core Bytes",
   ]
   Instances = ["------"] # Use 6 x - to remove the Instance bit from the counterPath.
   Measurement = "win_mem"

 [[inputs.win_perf_counters.object]]
   # Example query where the Instance portion must be removed to get data back,
   # such as from the Paging File object.
   ObjectName = "Paging File"
   Counters = [
     "% Usage",
   ]
   Instances = ["_Total"]
   Measurement = "win_swap"
Estamos listos para ir, tan simple como desde el PowerShell:
telegraf.exe --service start
Y si todo está bien, el fichero, la IP del server InfluxDB, etc, veremos lo siguiente:
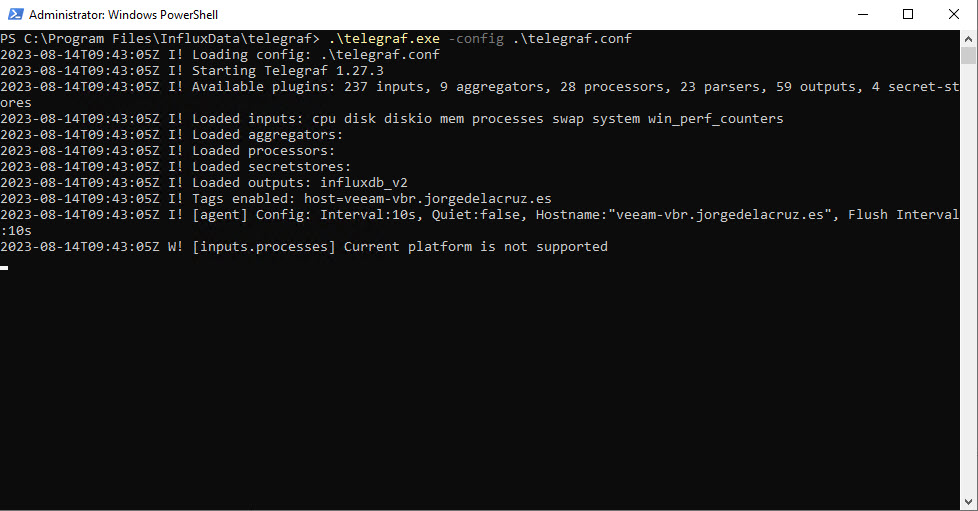
El ejecutable comenzará ha enviar métricas al server de InfluxDB con la frecuencia que tengamos seleccionada, por lo que veremos la línea de wrote batch of X metrics todo el rato, eso está bien y es que funciona 🙂
Consumir la información del agente de telegraf windows en Grafana
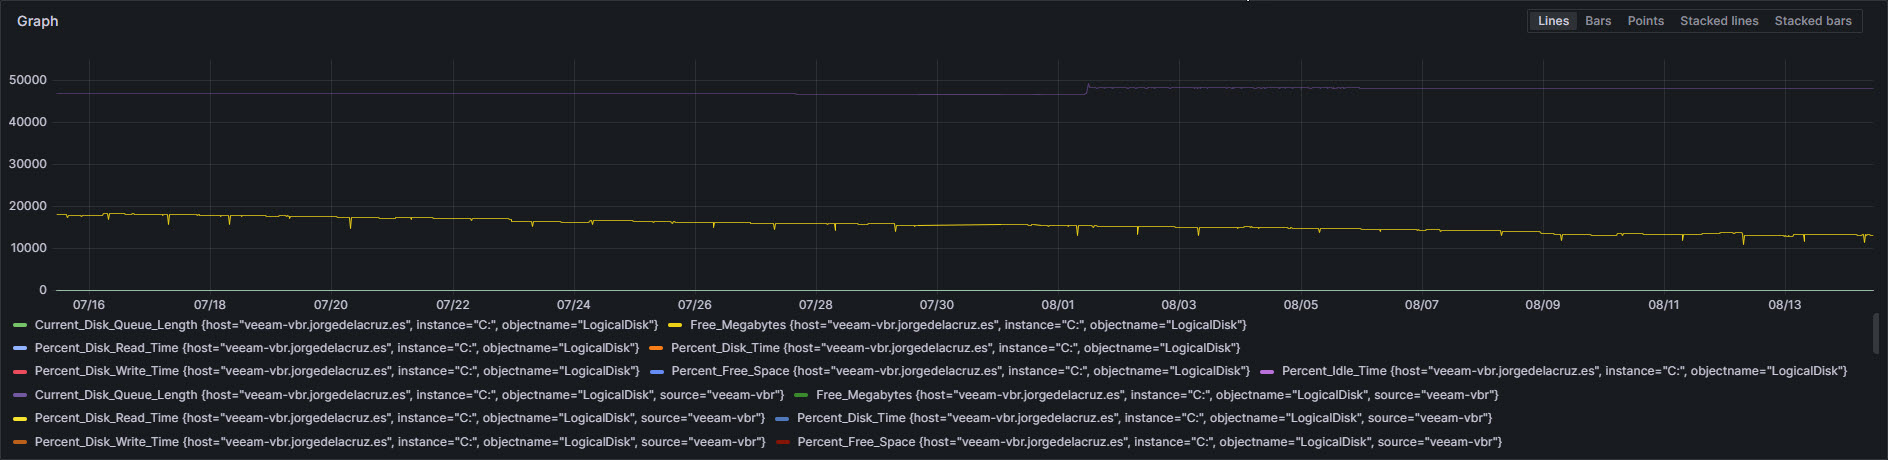
Si nos vamos ahora a nuestro Grafana, haremos click en Explore, y con la siguiente consulta podremos ver CPU, RAM, y otros, dependiendo del nombre de la métrica:
Para CPU (cambiar vuestro hostname)
from(bucket: "telegraf")
  |> range(start: v.timeRangeStart, stop: v.timeRangeStop)
  |> filter(fn: (r) => r["_measurement"] == "win_cpu")
  |> filter(fn: (r) => r["host"] == "veeam-vbr.jorgedelacruz.es")
  |> aggregateWindow(every: v.windowPeriod, fn: last, createEmpty: false)
  |> yield(name: "last")

Para RAM
from(bucket: "telegraf")
  |> range(start: v.timeRangeStart, stop: v.timeRangeStop)
  |> filter(fn: (r) => r["_measurement"] == "win_mem")
  |> filter(fn: (r) => r["host"] == "veeam-vbr.jorgedelacruz.es")
  |> aggregateWindow(every: v.windowPeriod, fn: mean, createEmpty: false)
  |> yield(name: "mean")
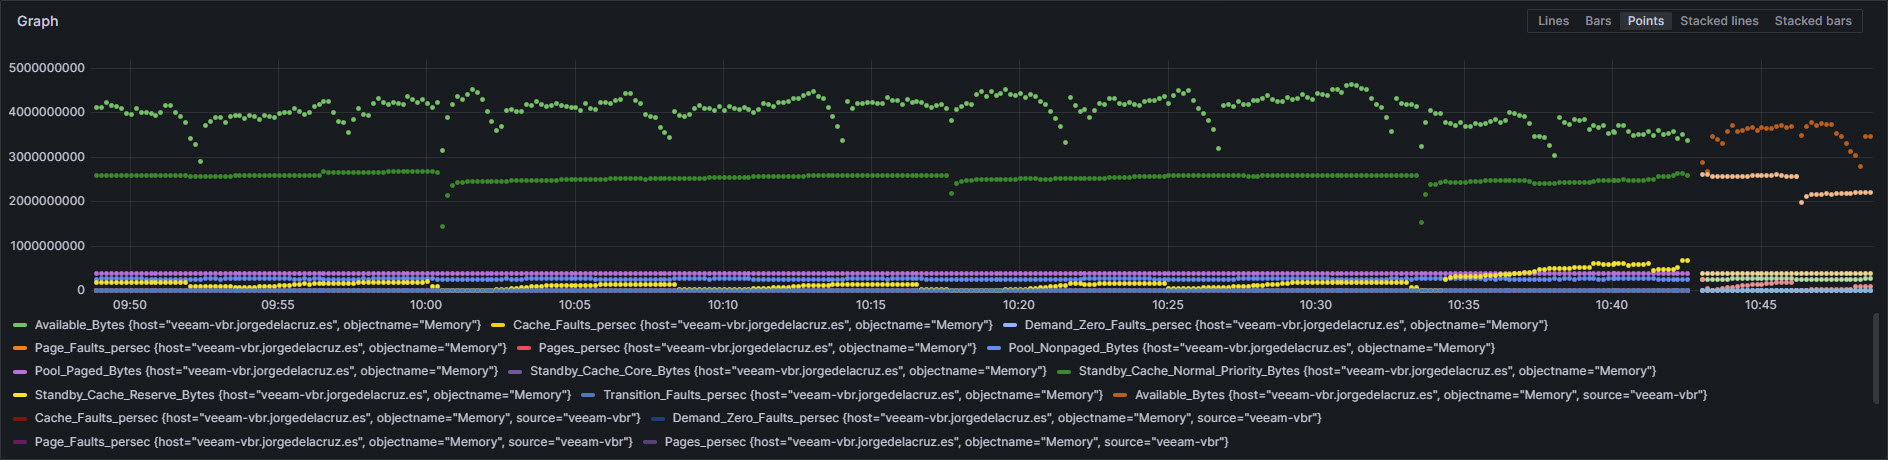
Para Disco
from(bucket: "telegraf")
  |> range(start: v.timeRangeStart, stop: v.timeRangeStop)
  |> filter(fn: (r) => r["_measurement"] == "win_disk")
  |> filter(fn: (r) => r["host"] == "veeam-vbr.jorgedelacruz.es")
  |> aggregateWindow(every: v.windowPeriod, fn: mean, createEmpty: false)
  |> yield(name: "mean")
 Para Red
from(bucket: "telegraf")
  |> range(start: v.timeRangeStart, stop: v.timeRangeStop)
  |> filter(fn: (r) => r["_measurement"] == "win_net")
  |> filter(fn: (r) => r["host"] == "veeam-vbr.jorgedelacruz.es")
  |> aggregateWindow(every: v.windowPeriod, fn: mean, createEmpty: false)
  |> yield(name: "mean")

Una vez que estamos satisfechos con los resultados, y vemos que nuestro agente de Telegraf está bien configurado, sería el momento de empezar a crear visualizaciones con estas queries.
Espero que os guste, y me gustaría dejaros la serie completa aquí, para que empecéis a jugar con los plugins que os he ido contando todos estos años:
- En busca del Dashboard perfecto: InfluxDB, Telegraf y Grafana – Parte I (Instalando InfluxDB, Telegraf y Grafana)
- En busca del Dashboard perfecto: InfluxDB, Telegraf y Grafana – Parte II (Instalar agente Telegraf en Nodos remotos Linux)
- En busca del Dashboard perfecto: InfluxDB, Telegraf y Grafana – Parte III Integración con PRTG
- En busca del Dashboard perfecto: InfluxDB, Telegraf y Grafana – Parte IV (Instalar agente Telegraf en Nodos remotos Windows)
- En busca del Dashboard perfecto: InfluxDB, Telegraf y Grafana – Parte V (Activar inputs específicos, Red, MySQL/MariaDB, Nginx)
- En busca del Dashboard perfecto: InfluxDB, Telegraf y Grafana – Parte VI (Monitorizando Veeam)
- En busca del Dashboard perfecto: InfluxDB, Telegraf y Grafana – Parte VII (Monitorizar vSphere)
- En busca del Dashboard perfecto: InfluxDB, Telegraf y Grafana – Parte VIII (Monitorizando Veeam con Enterprise Manager)
- En busca del Dashboard perfecto: InfluxDB, Telegraf y Grafana – Parte IX (Monitorizando Zimbra Collaboration)
- En busca del Dashboard perfecto: InfluxDB, Telegraf y Grafana – Parte X (Grafana Plugins)
- En busca del Dashboard perfecto: InfluxDB, Telegraf y Grafana – Parte XI
- En busca del Dashboard perfecto: InfluxDB, Telegraf y Grafana – Parte XII – Plugin nativo de Telegraf para vSphere
- En busca del Dashboard perfecto: InfluxDB, Telegraf y Grafana – Parte XIII – Veeam Backup for Microsoft Office 365
- En busca del Dashboard perfecto: InfluxDB, Telegraf y Grafana – Parte XIV – Veeam Availability Console
- En busca del Dashboard perfecto: InfluxDB, Telegraf y Grafana – Parte XV – Monitorización IPMI de nuestros Hosts ESXi
- En busca del Dashboard perfecto: InfluxDB, Telegraf y Grafana – Parte XVI – Rendimiento y seguridad avanzada de Veeam Backup for Microsoft Office 365
- En busca del Dashboard perfecto: InfluxDB, Telegraf y Grafana – Parte XVII – Mostrando los Dashboards en dos monitores usando Raspberry Pi 4
- En busca del Dashboard perfecto: InfluxDB, Telegraf y Grafana – Parte XVIII – Monitorizar temperatura y estado de Raspberry Pi 4
- En busca del Dashboard perfecto: InfluxDB, Telegraf y Grafana – Parte XIX (Monitorizando Veeam con Enterprise Manager) Shell Script
- En busca del Dashboard perfecto: InfluxDB, Telegraf y Grafana – Parte XX (Monitorizando Certificados SSL x.509)
- En busca del Dashboard perfecto: InfluxDB, Telegraf y Grafana – Parte XXI (Monitorizando HTTP Responses)
- En busca del Dashboard perfecto: InfluxDB, Telegraf y Grafana – Parte XXII (Monitorizando Cloudflare con Mapa)
- En busca del Dashboard perfecto: InfluxDB, Telegraf y Grafana – Parte XXIII (Monitorizando WordPress con Jetpack RESTful API)
- En Busca del Dashboard perfecto: InfluxDB, Telegraf y Grafana – Parte XXIV (Monitorizando de Veeam for Microsoft Azure)
- En Busca del Dashboard perfecto: InfluxDB, Telegraf y Grafana – Parte XXV (Monitorizando Consumo Eléctrico)
- En Busca del Dashboard perfecto: InfluxDB, Telegraf y Grafana – Parte XXVI (Monitorizando Veeam Backup for Nutanix)
- En Busca del Dashboard perfecto: InfluxDB, Telegraf y Grafana – Parte XXVII (Monitorizando ReFS y XFS (block-cloning y reflink)
- En Busca del Dashboard perfecto: InfluxDB, Telegraf y Grafana – Parte XXVIII (Monitorizando HPE StoreOnce)
- En Busca del Dashboard perfecto: InfluxDB, Telegraf y Grafana – Parte XXIX (Monitorizando PiHole)
- En Busca del Dashboard perfecto: InfluxDB, Telegraf y Grafana – Parte XXX (Monitorizando Veeam Backup for AWS)
- En Busca del Dashboard perfecto: InfluxDB, Telegraf y Grafana – Parte XXXI (Monitorizando Unifi Protect)
- En Busca del Dashboard perfecto: InfluxDB, Telegraf y Grafana – Parte XXXII (Monitorizando Veeam ONE – experimental)
- En Busca del Dashboard perfecto: InfluxDB, Telegraf y Grafana – Parte XXXIII (Monitorizando NetApp ONTAP)
- En Busca del Dashboard perfecto: InfluxDB, Telegraf y Grafana – Parte XXXIV (Monitorizando Goldshell Miners – JSONv2)
Hola, gracias por estas entradas tan instructivas y entretenidas….
…estoy haciendo pruebas con un Windows server 2012 pero aunque parece que envia los datos, cuando quiero crear un grafico en “select measurement” no me aparece nada que empieze por win_xxxx
PS C:\Users\Administrador\Downloads\telegraf-1.2.0_windows_amd64\telegraf> .\telegraf –config .\telegraf.conf –debug
E! Unable to create /Program Files/Telegraf/telegraf.log (open /Program Files/Telegraf/telegraf.log: El sistema no puede
encontrar la ruta especificada.), using stderr
2017-01-30T11:56:05Z D! Attempting connection to output: influxdb
2017-01-30T11:56:05Z D! Successfully connected to output: influxdb
2017-01-30T11:56:05Z I! Starting Telegraf (version 1.2.0)
2017-01-30T11:56:05Z I! Loaded outputs: influxdb
2017-01-30T11:56:05Z I! Loaded inputs: inputs.win_perf_counters
2017-01-30T11:56:05Z I! Tags enabled: host= xxxxxxxx
2017-01-30T11:56:05Z I! Agent Config: Interval:10s, Quiet:false, Hostname:”xxxxx”, Flush Interval:10s
2017-01-30T11:56:20Z D! Output [influxdb] buffer fullness: 0 / 1000 metrics.
2017-01-30T11:56:30Z D! Output [influxdb] buffer fullness: 0 / 1000 metrics.
2017-01-30T11:56:40Z D! Output [influxdb] buffer fullness: 0 / 1000 metrics.
Alguna sugerencia?
Saludos.
Saludos David,
Como ves en el error, tu telegraf no esta cogiendo la configuracion de la ruta adecuada, estas ejecutando Telegraf desde la carpeta de downloads, pero el servicio esta intentando abrir
/Program Files/Telegraf/telegraf.log
Si puedes mover todo a esa ruta no tendrás el error:
PS C:\Users\Administrador\Downloads\telegraf-1.2.0_windows_amd64\telegraf> .\telegraf –config .\telegraf.conf –debug
E! Unable to create /Program Files/Telegraf/telegraf.log (open /Program Files/Telegraf/telegraf.log: El sistema no puede
encontrar la ruta especificada.), using stderr
Un saludo!
No era eso……
2017-01-30T13:58:50Z D! Attempting connection to output: influxdb
2017-01-30T13:58:50Z D! Successfully connected to output: influxdb
2017-01-30T13:58:50Z I! Starting Telegraf (version 1.2.0)
2017-01-30T13:58:50Z I! Loaded outputs: influxdb
2017-01-30T13:58:50Z I! Loaded inputs: inputs.win_perf_counters
2017-01-30T13:58:50Z I! Tags enabled: host= xxxxxx
2017-01-30T13:58:50Z I! Agent Config: Interval:10s, Quiet:false, Hostname:”xxxxxxx”, Flush Interval:10s
2017-01-30T13:59:10Z D! Output [influxdb] buffer fullness: 0 / 1000 metrics.
2017-01-30T13:59:20Z D! Output [influxdb] buffer fullness: 0 / 1000 metrics.
2017-01-30T13:59:30Z D! Output [influxdb] buffer fullness: 0 / 1000 metrics.
Ya funciona!?
Que sucedía entonces David? Puedes ya ver los win dentro de grafana?
Un saludo
No, sigue sin funcionar, no manda ningun dato al grafana.
Cuando quiero crear un grafico en la opción “select measurement” no me aparece nada que empieze por win_xxxx
Puedes pegar el log entero que te da, desde que arranca hasta que empieza a enviar datos? El agente de Windows 🙂
Un saludo
El log está entero…. la última línea se sigue repitiendo pero siempre igual… no escribe nada si se usa win_perf
No faltará algún plugin ?
Pega el log desde que ejecutas telegraf.exe -c telegraf.conf hasta que se empieza a repetir 🙂
2017-01-30T17:57:10Z D! Attempting connection to output: influxdb
2017-01-30T17:57:10Z D! Successfully connected to output: influxdb
2017-01-30T17:57:10Z I! Starting Telegraf (version 1.2.0)
2017-01-30T17:57:10Z I! Loaded outputs: influxdb
2017-01-30T17:57:10Z I! Loaded inputs: inputs.win_perf_counters
2017-01-30T17:57:10Z I! Tags enabled: host=xxxxxxxx
2017-01-30T17:57:10Z I! Agent Config: Interval:10s, Quiet:false, Hostname:”xxxxxxxxx”, Flush Interval:10s
2017-01-30T17:57:30Z D! Output [influxdb] buffer fullness: 0 / 1000 metrics.
2017-01-30T17:57:40Z D! Output [influxdb] buffer fullness: 0 / 1000 metrics.
Los inputs que no funcionan son estos:
[[inputs.win_perf_counters.object]]
Si pongo este input de cpu en el fichero telegraf.conf si funciona:
# Read metrics about cpu usage
[[inputs.cpu]]
## Whether to report per-cpu stats or not
percpu = true
## Whether to report total system cpu stats or not
totalcpu = true
## Comment this line if you want the raw CPU time metrics
fielddrop = [“time_*”]
pero no tengo todas las opciones de win_perf_counters
Gracias por todo y un saludo.
Yo tengo el mismo problema. No me funcionan los contadores. He estado investigando y si funciona en un windows 10 pero no en 2012. Por lo que veo los contadores del windows 2012 son diferentes del win 10. Solucion??
Como comente ayer el problema parece de los contadores, Las VM’s en VMware que tengan tools instaladas, modifica los contadores. Los cuales no son los mismos que en in windows normal
Ref:
https://rvdnieuwendijk.com/2012/06/19/use-performance-monitor-to-get-vm-performance-statistics/
Buenas.
Tengo el telegraf instalado en varios servidores linux gracias a este Blog. 😉
Ahora quiero instalarlo en los Windows, y en la primera prueba con un servidor win2012 r2 y un equipo win 7 me colgaban el influxdb, comente el
# [[inputs.win_perf_counters.object]]
# ObjectName = “Network Interface”
que aparece repetido al final del archivo .conf y parece funcionar bien.
El problema actual es al generar una plantilla en grafana para los datos de red, en linux las interfaces son eth0, eth1, em1. Pero en windows no existen como interfaces y lo que tengo es instance y son los nombres de las controladoras que en cada servidor son diferentes
ejemplo :
win_net,instance=Controladora\ Fast\ Ethernet\ Atheros\ AR8132\ PCI-E\ [NDIS\ 6.20]
Existe forma de estandarizar esto ??
Gracias.
Saludos Josra,
Tengo que encender el laboratorio para decirte, recuerdo que se podía hacer a nivel de nombre de interfaz, con lo que si les llamadas a todas LAN o algo así podrías estandarizarlo, déjame confirmar.
Un saludo
Amigo antes que nada muchas gracias por toda la información, quisiera hacerte una pregunta… Tu sabes como se podría instalar Telegraf en servidores Solaris, ya que por mas que busco en la web no eh encontrado nada en concreto… Si bien el servidor con Telegraf, InfluxDB, y Grafana están instalados en una maquina Centos 7 (la cual no presenta problemas), no he podido lograr instalar Telegraf en maquinas Solaris 10, si tu sabes como ¿podrías ayudarme?
De antemano mucha gracias.
Saludos Hector,
Si no está la manera de instalarlo aquí – https://portal.influxdata.com/downloads#telegraf Siempre podrías mediante scripts enviar la información directamente a InfluxDB con los contadores y los resultados.
Un saludo
Hola, tengo instalado influxdb, telegraf y grafana en un ubuntu server. Estoy tratando de ver datos de servidores windows (2012), como ram, disco, etc…Queiro mencionar que soy principiante en esto, quizas anote alguna configuracion mal nose, dejo lo que me da en el shell de windows:
PS C:\users\Fernando Carrasco\desktop\telegraf> .\telegraf.exe -config .\telegraf.conf -debug
2020-01-21T14:49:33Z I! Starting Telegraf 1.13.1
2020-01-21T14:49:33Z I! Loaded inputs: win_perf_counters
2020-01-21T14:49:33Z I! Loaded aggregators:
2020-01-21T14:49:33Z I! Loaded processors:
2020-01-21T14:49:33Z I! Loaded outputs: influxdb
2020-01-21T14:49:33Z I! Tags enabled: host=cm-milton
2020-01-21T14:49:33Z I! [agent] Config: Interval:10s, Quiet:false, Hostname:”cm-milton”, Flush Interval:10s
2020-01-21T14:49:33Z D! [agent] Initializing plugins
2020-01-21T14:49:33Z D! [agent] Connecting outputs
2020-01-21T14:49:33Z D! [agent] Attempting connection to [outputs.influxdb]
2020-01-21T14:49:33Z W! [outputs.influxdb] When writing to [http://172.16.2.107:3000]: database “telegraf” creation failed: 404 Not Found
2020-01-21T14:49:33Z D! [agent] Successfully connected to outputs.influxdb
2020-01-21T14:49:33Z D! [agent] Starting service inputs
2020-01-21T14:49:50Z E! [outputs.influxdb] When writing to [http://172.16.2.107:3000]: 404 Not Found
2020-01-21T14:49:50Z D! [outputs.influxdb] Buffer fullness: 26 / 10000 metrics
2020-01-21T14:49:50Z E! [agent] Error writing to outputs.influxdb: could not write any address
2020-01-21T14:50:00Z E! [outputs.influxdb] When writing to [http://172.16.2.107:3000]: 404 Not Found
2020-01-21T14:50:00Z D! [outputs.influxdb] Buffer fullness: 26 / 10000 metrics
2020-01-21T14:50:00Z E! [agent] Error writing to outputs.influxdb: could not write any address
2020-01-21T14:50:10Z E! [outputs.influxdb] When writing to [http://172.16.2.107:3000]: 404 Not Found
2020-01-21T14:50:10Z D! [outputs.influxdb] Buffer fullness: 39 / 10000 metrics
2020-01-21T14:50:10Z E! [agent] Error writing to outputs.influxdb: could not write any address
2020-01-21T14:50:20Z E! [outputs.influxdb] When writing to [http://172.16.2.107:3000]: 404 Not Found
2020-01-21T14:50:20Z D! [outputs.influxdb] Buffer fullness: 52 / 10000 metrics
2020-01-21T14:50:20Z E! [agent] Error writing to outputs.influxdb: could not write any address
2020-01-21T14:50:22Z D! [agent] Stopping service inputs
2020-01-21T14:50:22Z D! [agent] Input channel closed
2020-01-21T14:50:22Z I! [agent] Hang on, flushing any cached metrics before shutdown
2020-01-21T14:50:22Z E! [outputs.influxdb] When writing to [http://172.16.2.107:3000]: 404 Not Found
2020-01-21T14:50:22Z D! [outputs.influxdb] Buffer fullness: 65 / 10000 metrics
2020-01-21T14:50:22Z E! [agent] Error writing to outputs.influxdb: could not write any address
Estimado, al ejecutar el comando me envia el siguiente log. me dice que no se pudo escribir la informacion porque el equipo local rechazo la informacion.
2020-01-22T16:05:38Z I! Starting Telegraf 1.13.1
2020-01-22T16:05:38Z I! Loaded inputs: win_perf_counters
2020-01-22T16:05:38Z I! Loaded aggregators:
2020-01-22T16:05:38Z I! Loaded processors:
2020-01-22T16:05:38Z I! Loaded outputs: influxdb
2020-01-22T16:05:38Z I! Tags enabled: host=cm-milton
2020-01-22T16:05:38Z I! [agent] Config: Interval:10s, Quiet:false, Hostname:”cm-milton”, Flush Interval:10s
2020-01-22T16:05:38Z D! [agent] Initializing plugins
2020-01-22T16:05:38Z D! [agent] Connecting outputs
2020-01-22T16:05:38Z D! [agent] Attempting connection to [outputs.influxdb]
2020-01-22T16:05:41Z W! [outputs.influxdb] When writing to [http://localhost:8086]: database “telegraf” creation failed: Post http://localhost:8086/query: dial tcp [::1]:8086: connectex: No se puede establecer una conexión ya que el equipo de destino denegó expresamente dicha conexión.
2020-01-22T16:05:41Z D! [agent] Successfully connected to outputs.influxdb
2020-01-22T16:05:41Z D! [agent] Starting service inputs
2020-01-22T16:06:02Z E! [outputs.influxdb] When writing to [http://localhost:8086]: Post http://localhost:8086/write?db=telegraf: dial tcp [::1]:8086: connectex: No se puede establecer una conexión ya que el equipo de destino denegó expresamente dicha conexión.
2020-01-22T16:06:02Z D! [outputs.influxdb] Buffer fullness: 26 / 10000 metrics
2020-01-22T16:06:02Z E! [agent] Error writing to outputs.influxdb: could not write any address
2020-01-22T16:06:12Z E! [outputs.influxdb] When writing to [http://localhost:8086]: Post http://localhost:8086/write?db=telegraf: dial tcp [::1]:8086: connectex: No se puede establecer una conexión ya que el equipo de destino denegó expresamente dicha conexión.
2020-01-22T16:06:12Z D! [outputs.influxdb] Buffer fullness: 39 / 10000 metrics
2020-01-22T16:06:12Z E! [agent] Error writing to outputs.influxdb: could not write any address
2020-01-22T16:06:17Z D! [agent] Stopping service inputs
2020-01-22T16:06:17Z D! [agent] Input channel closed
2020-01-22T16:06:17Z I! [agent] Hang on, flushing any cached metrics before shutdown
2020-01-22T16:06:20Z E! [outputs.influxdb] When writing to [http://localhost:8086]: Post http://localhost:8086/write?db=telegraf: dial tcp [::1]:8086: connectex: No se puede establecer una conexión ya que el equipo de destino denegó expresamente dicha conexión.
2020-01-22T16:06:20Z D! [outputs.influxdb] Buffer fullness: 39 / 10000 metrics
2020-01-22T16:06:20Z E! [agent] Error writing to outputs.influxdb: could not write any address
2020-01-22T16:06:20Z D! [agent] Closing outputs
Quiza si editas el telegraf.conf y usas el hostname del equipo mejor? Ademas de tener por supuesto el /etc/hosts y la resolucion de DNS bien configurada, prueba a ver 🙂
Jorge gracias por responder, he tenido muchos problemas para instalar telegraf en windows y me tire los datos a influxdb que tengo instalado en ubuntu server.
Hice todos los pasos que pusiste mas arriba, me habia equivocado en la configuracion del telegraf.confg que esta en windows. al corregirlo funciono pero sigue sin escribir los datos en influxdb, me lanza lo siguiente…(el equipo de origen y destino tienen el firewall desactivado)
PS C:\Archivos de programa\telegraf> ./telegraf.exe -config telegraf.conf
2020-01-28T17:18:32Z I! Starting Telegraf 1.13.1
2020-01-28T17:18:32Z I! Loaded inputs: win_perf_counters cpu disk mem
2020-01-28T17:18:32Z I! Loaded aggregators:
2020-01-28T17:18:32Z I! Loaded processors:
2020-01-28T17:18:32Z I! Loaded outputs: influxdb
2020-01-28T17:18:32Z I! Tags enabled: host=cm-milton
2020-01-28T17:18:32Z I! [agent] Config: Interval:10s, Quiet:false, Hostname:”cm-milton”, Flush Interval:10s
2020-01-28T17:18:34Z W! [outputs.influxdb] When writing to [http://127.0.0.1:8086]: database “telegraf” creation failed: Post http://127.0.0.1:8086/query: dial tcp 127.0.0.1:8086: connectex: No se puede establecer una conexión ya que el equipo de destino denegó expresamente dicha conexión.
Saludos Fernando,
No se que tienes en la configuracion de output, pero esta intentando escribir a 127.0.0.1, no a la IP de tu Ubuntu VM.
Un saludo
Jorge, acabo de cambiar la IP y me funciono sin problemas, me agrego los repocitorios al influxdb y todo bien, pero en windows me sigue saliendo esto…
PS C:\Archivos de programa\telegraf> ./telegraf.exe -config telegraf.conf
2020-01-28T17:47:56Z I! Starting Telegraf 1.13.1
2020-01-28T17:47:56Z I! Loaded inputs: mem win_perf_counters cpu disk
2020-01-28T17:47:56Z I! Loaded aggregators:
2020-01-28T17:47:56Z I! Loaded processors:
2020-01-28T17:47:56Z I! Loaded outputs: influxdb
2020-01-28T17:47:56Z I! Tags enabled: host=cm-milton
2020-01-28T17:47:56Z I! [agent] Config: Interval:10s, Quiet:false, Hostname:”cm-milton”, Flush Interval:10s
2020-01-28T17:52:30Z E! [inputs.cpu] Error in plugin: Error: current total CPU time is less than previous total CPU time
2020-01-28T18:00:40Z E! [inputs.cpu] Error in plugin: Error: current total CPU time is less than previous total CPU time
2020-01-28T18:08:40Z E! [inputs.cpu] Error in plugin: Error: current total CPU time is less than previous total CPU time
Gracias Jorge, tenias toda la razon, al cambiar la ip me agrego todos los repositorios al influxdb y se agregaron al grafana sin embargo en el powershell donde instale el agente telegraf me aparece esto..
PS C:\Archivos de programa\telegraf> ./telegraf.exe -config telegraf.conf
2020-01-28T17:47:56Z I! Starting Telegraf 1.13.1
2020-01-28T17:47:56Z I! Loaded inputs: mem win_perf_counters cpu disk
2020-01-28T17:47:56Z I! Loaded aggregators:
2020-01-28T17:47:56Z I! Loaded processors:
2020-01-28T17:47:56Z I! Loaded outputs: influxdb
2020-01-28T17:47:56Z I! Tags enabled: host=cm-milton
2020-01-28T17:47:56Z I! [agent] Config: Interval:10s, Quiet:false, Hostname:”cm-milton”, Flush Interval:10s
2020-01-28T17:52:30Z E! [inputs.cpu] Error in plugin: Error: current total CPU time is less than previous total CPU time
2020-01-28T18:00:40Z E! [inputs.cpu] Error in plugin: Error: current total CPU time is less than previous total CPU time
2020-01-28T18:08:40Z E! [inputs.cpu] Error in plugin: Error: current total CPU time is less than previous total CPU time
2020-01-28T18:16:40Z E! [inputs.cpu] Error in plugin: Error: current total CPU time is less than previous total CPU time
2020-01-28T18:24:20Z E! [inputs.cpu] Error in plugin: Error: current total CPU time is less than previous total CPU time
2020-01-28T18:32:50Z E! [inputs.cpu] Error in plugin: Error: current total CPU time is less than previous total CPU time
2020-01-28T18:40:50Z E! [inputs.cpu] Error in plugin: Error: current total CPU time is less than previous total CPU time
Saludos,
Nunca he tenido este problema, prueba con esto:
https://github.com/influxdata/telegraf/issues/4629
https://github.com/influxdata/telegraf/issues/4629Gracias Jorge, te molesto con otra cosa…Necesito monitorear Servidores Windows y linux pero en un solo tablero, sabes como hacerlo?, ya que he bajado algunos tableros solo para linux y otros solo para windows pero me gustaria tener todos los servidores solo en 1.
SAludos.
Gracias Jorge por compartir. Les dejo un comentario. Estaba demorando más de la cuenta con Telegraf desde Windows y era debido a que mi servidor Influxdb en Linux escuchaba en el 127.0.0.1.
Entonces nunca lograban conectarse. Para eso modifique el bind_server en el infludb.conf. Luego en grafana hice los ajustes para conectarse en el host con ip y no localhost.
Saludos y Muchas gracias por el aporte de todos! El mejor Blog en español!!