
 Saludos amigos, hoy os traigo una nueva entrada sobre Grafana, la de hoy además es una de las más especiales que he escrito, ya que se trata de una versión experimental, y que no sabemos si esto llegará a algún puerto, o se cambiará en el futuro.
Estoy hablando ni más ni menos que un ¡Dashboard de Grafana para Veeam ONE! Si, imaginaros combinar todo el potencial que tiene Veeam ONE, que ya analiza VMware, Veeam, nos da recomendaciones, consumos, capacity planning, etc. Y poner todos esos datos en un bello Dashboard de Grafana, pues eso es lo que vamos a hacer hoy.
Antes de comenzar, y por si el experimental no es suficiente, quiero recordar que esta RESTful API de Veeam ONE se considera interna, con lo que su uso no está soportado por Veeam, usar este Dashboard bajo vuestra responsabilidad.
Dashboard para Veeam ONE (experimental)
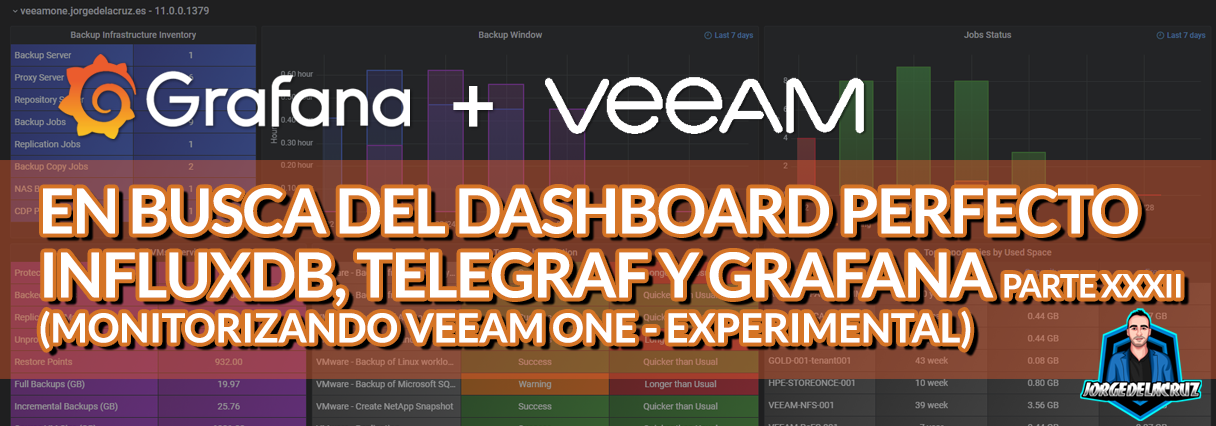
Cuando terminemos la entrada tendremos algo similar a ese Dashboard que te permitirá visualizar:
Dashboard – Resumen
Este primer dashboard de la serie, porque tengo intención de crear todos los Dashboards que Veeam ONE nos otorga, contiene:
- Backup Infrastructure Inventory– Cuántos componentes de Veeam tenemos agregados a este Veeam ONE
- Backup Window – Una gráfica donde encontramos los últimos 7 días con las ventanas de trabajo de Backup, Replica, y NAS .
- Job Status – Una gráfica donde encontramos los últimos 7 días con los trabajos que han sido satisfactorios, o que han tenido warning o error.
- Protected VMs Overview – Una tabla muy completa donde se nos muestra todas nuestras VMs, las que están protegidas, las que no, tamaño de las copias, etc.
- Top Jobs by Duration – Una tabla muy completa donde encontramos nuestros trabajos, y la duración de los mismos, con información adicional si está tomando más tiempo de lo normal o no.
- Top Repositories by Used Space – Una tabla muy completa donde encontramos nuestros trabajos, y la duración de los mismos, con información adicional si está tomando más tiempo de lo normal o no.
Topología con todos los componentes lógicos
Esta entrada es similar a las anteriores ya que en este caso, usaremos una combinación de un shell script para recolectar las métricas de Veeam ONE usando RESTful API e InfluxDB. El diseño sería algo similar a esto:
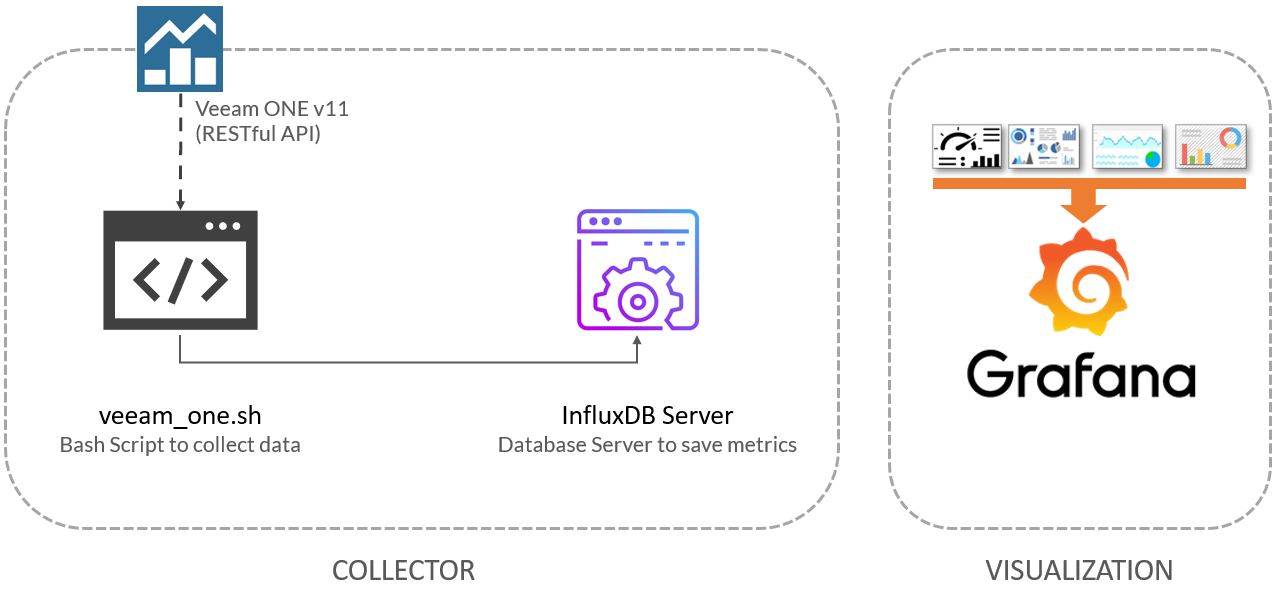 Como podemos ver, el shell script descargará las métricas de Veeam ONE usando la API RESTful, que enviará todos los datos a InfluxDB, desde donde podremos verlos cómodamente con Grafana.
Descargar, y configurar el script the veeam_one.sh
Tenemos casi todo listo, tenemos un último paso, el guión que hará que todo esto funcione, descargaremos la última versión del repositorio Github:
Este script de shell, puede ser descargado y ejecutado desde el servidor de telegraf, o influxDB, o cualquier otro Linux. Tendremos que editar los parámetros de configuración:
veeamInfluxDBURL="YOURINFLUXSERVER" ##Use https://fqdn or https://IP in case you use SSL
veeamInfluxDBPort="8086" #Default Port
veeamInfluxDB="YOURINFLUXDB" #Default Database
veeamInfluxDBUser="YOURINFLUXUSER" #User for Database
veeamInfluxDBPassword="YOURINFLUXPASS" #Password for Database

# Endpoint URL for login action
veeamUsername="YOURVEEAMONEUSER" #Usually domain\user or [email protected]
veeamPassword="YOURVEEAMONEPASS"
veeamONEServer="https://YOURVEEAMONEIP" #You can use FQDN if you like as well
veeamONEPort="1239" #Default Port
Una vez que los cambios estén hechos, haz el script ejecutable con chmod:
chmod +x veeam_one.sh
Lo ejecutamos, y la salida del comando debe ser algo parecido a la siguiente, sin errores:
Writing veeam_ONE_repositories to InfluxDB
HTTP/1.1 204 No Content
Content-Type: application/json
Request-Id: 9e9c517e-7a11-11eb-8acb-0050569017a8
X-Influxdb-Build: OSS
X-Influxdb-Version: 1.8.4
X-Request-Id: 9e9c517e-7a11-11eb-8acb-0050569017a8
Date: Sun, 28 Feb 2021 22:09:25 GMT
Si es así, por favor, ahora agrega este script a tu crontab, como por ejemplo cada 30 minutos, no creo que nuestros Dashboards se actualicen más amenudo, pero bueno bajarlo si así es:
*/30 * * * * /home/oper/veeam_one.sh >> /var/log/veeamone.log 2>&1
Estamos listos para irnos al siguiente paso.
Grafana Dashboards
He creado un Dashboard desde cero seleccionando las mejores solicitudes a la base de datos, terminando los colores, pensando en los gráficos y en cómo mostrarlos, y todo está automatizado para que se ajuste a nuestro entorno sin ningún problema y sin tener que editar nada manualmente. El Dashboard se puede encontrar aquí, una vez importado, puedes usar los menús desplegables superiores para seleccionar entre dispositivos de Protect, etc:
Importar el Dashboard de Grafana de manera sencilla
Para que no tengas que perder horas configurando un nuevo Dashboard, e ingiriendo y depurando lo que quieras, ya he creado un maravilloso Dashboards con todo lo que necesitas para monitorizar nuestro entorno de una forma muy sencilla, se verá como la imagen que te mostré arriba. Selecciona el nombre que quieras e introduce el ID: 13986, que es el ID único del Dashboard, o la URL:
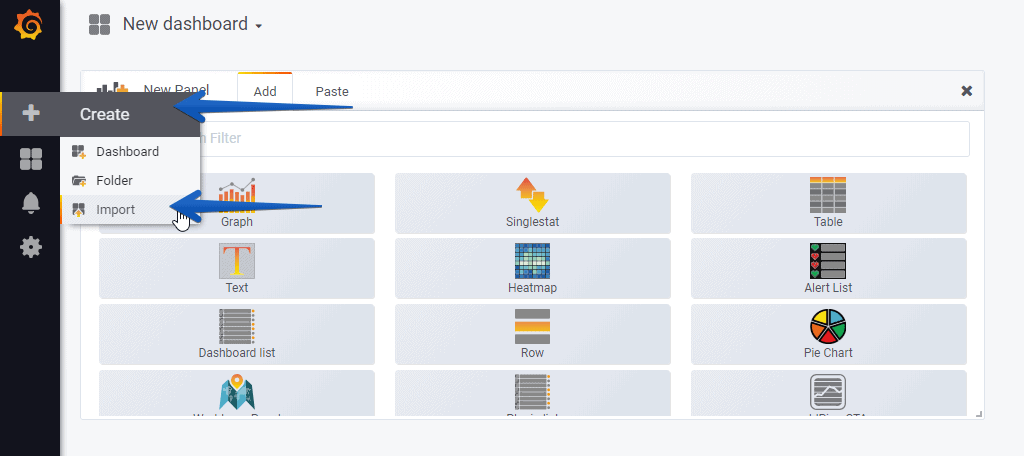 Con los menús de arriba, podremos movernos entre Veeam ONE Servers (sí, ésto está pensado para Proveedores de Servicio también):Por favor, dejar vuestros comentarios aquí, o en GitHub. ¡Muchas gracias por la lectura!
Espero que os guste, y me gustaría dejaros la serie completa aquí, para que empecéis a jugar con los plugins que os he ido contando todos estos años:
- En busca del Dashboard perfecto: InfluxDB, Telegraf y Grafana – Parte I (Instalando InfluxDB, Telegraf y Grafana)
- En busca del Dashboard perfecto: InfluxDB, Telegraf y Grafana – Parte II (Instalar agente Telegraf en Nodos remotos Linux)
- En busca del Dashboard perfecto: InfluxDB, Telegraf y Grafana – Parte III Integración con PRTG
- En busca del Dashboard perfecto: InfluxDB, Telegraf y Grafana – Parte IV (Instalar agente Telegraf en Nodos remotos Windows)
- En busca del Dashboard perfecto: InfluxDB, Telegraf y Grafana – Parte V (Activar inputs específicos, Red, MySQL/MariaDB, Nginx)
- En busca del Dashboard perfecto: InfluxDB, Telegraf y Grafana – Parte VI (Monitorizando Veeam)
- En busca del Dashboard perfecto: InfluxDB, Telegraf y Grafana – Parte VII (Monitorizar vSphere)
- En busca del Dashboard perfecto: InfluxDB, Telegraf y Grafana – Parte VIII (Monitorizando Veeam con Enterprise Manager)
- En busca del Dashboard perfecto: InfluxDB, Telegraf y Grafana – Parte IX (Monitorizando Zimbra Collaboration)
- En busca del Dashboard perfecto: InfluxDB, Telegraf y Grafana – Parte X (Grafana Plugins)
- En busca del Dashboard perfecto: InfluxDB, Telegraf y Grafana – Parte XI
- En busca del Dashboard perfecto: InfluxDB, Telegraf y Grafana – Parte XII – Plugin nativo de Telegraf para vSphere
- En busca del Dashboard perfecto: InfluxDB, Telegraf y Grafana – Parte XIII – Veeam Backup for Microsoft Office 365
- En busca del Dashboard perfecto: InfluxDB, Telegraf y Grafana – Parte XIV – Veeam Availability Console
- En busca del Dashboard perfecto: InfluxDB, Telegraf y Grafana – Parte XV – Monitorización IPMI de nuestros Hosts ESXi
- En busca del Dashboard perfecto: InfluxDB, Telegraf y Grafana – Parte XVI – Rendimiento y seguridad avanzada de Veeam Backup for Microsoft Office 365
- En busca del Dashboard perfecto: InfluxDB, Telegraf y Grafana – Parte XVII – Mostrando los Dashboards en dos monitores usando Raspberry Pi 4
- En busca del Dashboard perfecto: InfluxDB, Telegraf y Grafana – Parte XVIII – Monitorizar temperatura y estado de Raspberry Pi 4
- En busca del Dashboard perfecto: InfluxDB, Telegraf y Grafana – Parte XIX (Monitorizando Veeam con Enterprise Manager) Shell Script
- En busca del Dashboard perfecto: InfluxDB, Telegraf y Grafana – Parte XX (Monitorizando Certificados SSL x.509)
- En busca del Dashboard perfecto: InfluxDB, Telegraf y Grafana – Parte XXI (Monitorizando HTTP Responses)
- En busca del Dashboard perfecto: InfluxDB, Telegraf y Grafana – Parte XXII (Monitorizando Cloudflare con Mapa)
- En busca del Dashboard perfecto: InfluxDB, Telegraf y Grafana – Parte XXIII (Monitorizando WordPress con Jetpack RESTful API)
- En Busca del Dashboard perfecto: InfluxDB, Telegraf y Grafana – Parte XXIV (Monitorizando de Veeam for Microsoft Azure)
- En Busca del Dashboard perfecto: InfluxDB, Telegraf y Grafana – Parte XXV (Monitorizando Consumo Eléctrico)
- En Busca del Dashboard perfecto: InfluxDB, Telegraf y Grafana – Parte XXVI (Monitorizando Veeam Backup for Nutanix)
- En Busca del Dashboard perfecto: InfluxDB, Telegraf y Grafana – Parte XXVII (Monitorizando ReFS y XFS (block-cloning y reflink)
- En Busca del Dashboard perfecto: InfluxDB, Telegraf y Grafana – Parte XXVIII (Monitorizando HPE StoreOnce)
- En Busca del Dashboard perfecto: InfluxDB, Telegraf y Grafana – Parte XXIX (Monitorizando PiHole)
- En Busca del Dashboard perfecto: InfluxDB, Telegraf y Grafana – Parte XXX (Monitorizando Veeam Backup for AWS)
- En Busca del Dashboard perfecto: InfluxDB, Telegraf y Grafana – Parte XXXI (Monitorizando Unifi Protect)
- En Busca del Dashboard perfecto: InfluxDB, Telegraf y Grafana – Parte XXXII (Monitorizando Veeam ONE – experimental)
- En Busca del Dashboard perfecto: InfluxDB, Telegraf y Grafana – Parte XXXIII (Monitorizando NetApp ONTAP)
- En Busca del Dashboard perfecto: InfluxDB, Telegraf y Grafana – Parte XXXIV (Monitorizando Goldshell Miners – JSONv2)
Hello,
i just tested this in our lab env. and we are getting the following errors:
(we are able to connect to veeam one, authenticate , grab api token) but result is not getting into the InfluxDB (with exception of Top repositories)
The error we get is:
Writing veeam_ONE_protectedvms to InfluxDB
HTTP/1.1 400 Bad Request
Content-Type: application/json
Request-Id: 779252c6-cf85-11eb-8030-005056ab4039
X-Influxdb-Build: OSS
X-Influxdb-Error: unable to parse ‘veeam_ONE_protectedvms,voneserver=deimos protectedvms=null,backuedupvms=null,replicatedvsize=,successratio=null’: invalid number
X-Influxdb-Version: 1.8.6
X-Request-Id: 779252c6-cf85-11eb-8030-005056ab4039
Date: Thu, 17 Jun 2021 16:02:50 GMT
Content-Length: 238
{“error”:”unable to parse ‘veeam_ONE_protectedvms,voneserver=deimos protectedvms=null,backuedupvms=null,replicatedvms=null,ccessratio=null’: invalid number”}
Writing veeam_ONE_backupinfrastructure to InfluxDB
HTTP/1.1 400 Bad Request
Content-Type: application/json
Request-Id: 77c142b0-cf85-11eb-8031-005056ab4039
X-Influxdb-Build: OSS
X-Influxdb-Error: unable to parse ‘veeam_ONE_backupinfrastructure,voneserver=deimos totalvbr=1,totalproxy=2,totalrepo=2,tot’: missing field value
X-Influxdb-Version: 1.8.6
X-Request-Id: 77c142b0-cf85-11eb-8031-005056ab4039
Date: Thu, 17 Jun 2021 16:02:51 GMT
Content-Length: 220
{“error”:”unable to parse ‘veeam_ONE_backupinfrastructure,voneserver=deimos totalvbr=1,totalproxy=2,totalrepo=2,totalbackupng field value”}
Writing veeam_ONE_jobs to InfluxDB
HTTP/1.1 204 No Content
Content-Type: application/json
Request-Id: 77e4aae6-cf85-11eb-8032-005056ab4039
X-Influxdb-Build: OSS
X-Influxdb-Version: 1.8.6
X-Request-Id: 77e4aae6-cf85-11eb-8032-005056ab4039
Date: Thu, 17 Jun 2021 16:02:51 GMT
Writing veeam_ONE_jobs to InfluxDB
HTTP/1.1 204 No Content
Content-Type: application/json
Request-Id: 77f2dbce-cf85-11eb-8033-005056ab4039
X-Influxdb-Build: OSS
X-Influxdb-Version: 1.8.6
X-Request-Id: 77f2dbce-cf85-11eb-8033-005056ab4039
Date: Thu, 17 Jun 2021 16:02:51 GMT
Any idea whats missing ?
We are using Influxdb-Version: 1.8.6 and latest Veeam One V11
Hello,
Did you upgrade from VONE v10 to v11? New deployment?
Best regards
Hello,
we upgraded from v10 to v11 ? Is that the issue ?
It should not, if using last bash shell script. I’ve tried on my site and worked perfectly fine. You have VMware or HyperV, Veeam server all attached?
Yup – latest script, and all are working in Veeam Backup and Replication and in Veeam One Client (i noticed it’s looking at “Dashboard” – is this part of the web client ? We dont use the web client of Veeam One )
I’m going to try the Enterprise manager monitoring script/Dashboard and see if there’s any difference.
Thanks.
Hello Vladimir,
The script uses the new API for v11, which is used on the Veeam ONE Web Client, do you have that installed? It is strange, the output you get has some missing letters, like this:
X-Influxdb-Error: unable to parse ‘veeam_ONE_backupinfrastructure,voneserver=deimos totalvbr=1,totalproxy=2,totalrepo=2,tot’: missing field value
I am not sure if you did wget of the script on your linux box, or copied paste and something is off perhaps?
i wget the script (no copy/paste)
I tried the Enterprise manager script and that fails as well.
It’s strange that everything in Veeam One, Veeam Enterprise manager etc looks fine
Which version of jq do you use ?
We use minimal CentOS 7 latest) and ‘jq’ from epel repo 1.6 – as that seems to be (at least partly) the issue
[root@monitor ~]# telnet 192.168.123.246 9398
Trying 192.168.123.246…
Connected to 192.168.123.246.
Escape character is ‘^]’.
^[^P
^[
Connection closed by foreign host.
[root@monitor ~]#
[root@monitor ~]#
[root@monitor ~]#
[root@monitor ~]# ./veeam_enterprisemanager.sh
Writing veeam_em_overview to InfluxDB
HTTP/1.1 400 Bad Request
Content-Type: application/json
Request-Id: 05ab78c2-d040-11eb-80c5-005056ab4039
X-Influxdb-Build: OSS
X-Influxdb-Error: unable to parse ‘veeam_em_overview,host=192.168.123.246 veeamBackupServers=null,veeamProxyServers=null,veeamRepositoryServers=null,veeamRunningJobs=null,veeamScheduledJobs=null,veeamSuccessfulVmLastestStates=null,veeamWarningVmLastestStates=null,veeamFailedVmLastestStates=null’: invalid number
X-Influxdb-Version: 1.8.6
X-Request-Id: 05ab78c2-d040-11eb-80c5-005056ab4039
Date: Fri, 18 Jun 2021 14:18:15 GMT
Content-Length: 307
{“error”:”unable to parse ‘veeam_em_overview,host=192.168.123.246 veeamBackupServers=null,veeamProxyServers=null,veeamRepositoryServers=null,veeamRunningJobs=null,veeamScheduledJobs=null,veeamSuccessfulVmLastestStates=null,veeamWarningVmLastestStates=null,veeamFailedVmLastestStates=null’: invalid number”}
Writing veeam_em_overview_vms to InfluxDB
HTTP/1.1 400 Bad Request
Content-Type: application/json
Request-Id: 05d8d9fe-d040-11eb-80c6-005056ab4039
X-Influxdb-Build: OSS
X-Influxdb-Error: unable to parse ‘veeam_em_overview_vms,host=192.168.123.246 veeamProtectedVms=null,veeamBackedUpVms=null,veeamReplicatedVms=null,veeamRestorePoints=null,veeamFullBackupPointsSize=null,veeamIncrementalBackupPointsSize=null,veeamReplicaRestorePointsSize=null,veeamSourceVmsSize=null,veeamSuccessBackupPercents=null’: invalid number
X-Influxdb-Version: 1.8.6
X-Request-Id: 05d8d9fe-d040-11eb-80c6-005056ab4039
Date: Fri, 18 Jun 2021 14:18:15 GMT
Content-Length: 342
{“error”:”unable to parse ‘veeam_em_overview_vms,host=192.168.123.246 veeamProtectedVms=null,veeamBackedUpVms=null,veeamReplicatedVms=null,veeamRestorePoints=null,veeamFullBackupPointsSize=null,veeamIncrementalBackupPointsSize=null,veeamReplicaRestorePointsSize=null,veeamSourceVmsSize=null,veeamSuccessBackupPercents=null’: invalid number”}
Writing veeam_em_overview_jobs to InfluxDB
HTTP/1.1 400 Bad Request
Content-Type: application/json
Request-Id: 0616d6e8-d040-11eb-80c7-005056ab4039
X-Influxdb-Build: OSS
X-Influxdb-Error: unable to parse ‘veeam_em_overview_jobs,host=192.168.123.246,veeamMaxDurationBackupJobName=null,veeamMaxDurationReplicaJobName=null veeamRunningJobs=null,veeamScheduledJobs=null,veeamScheduledBackupJobs=null,veeamScheduledReplicaJobs=null,veeamTotalJobRuns=null,veeamSuccessfulJobRuns=null,veeamWarningsJobRuns=null,veeamFailedJobRuns=null,veeamMaxJobDuration=null,veeamMaxBackupJobDuration=null,veeamMaxReplicaJobDuration=null’: invalid number
X-Influxdb-Version: 1.8.6
X-Request-Id: 0616d6e8-d040-11eb-80c7-005056ab4039
Date: Fri, 18 Jun 2021 14:18:16 GMT
Content-Length: 457
{“error”:”unable to parse ‘veeam_em_overview_jobs,host=192.168.123.246,veeamMaxDurationBackupJobName=null,veeamMaxDurationReplicaJobName=null veeamRunningJobs=null,veeamScheduledJobs=null,veeamScheduledBackupJobs=null,veeamScheduledReplicaJobs=null,veeamTotalJobRuns=null,veeamSuccessfulJobRuns=null,veeamWarningsJobRuns=null,veeamFailedJobRuns=null,veeamMaxJobDuration=null,veeamMaxBackupJobDuration=null,veeamMaxReplicaJobDuration=null’: invalid number”}
jq: error (at :1): Cannot iterate over null (null)
jq: error (at :1): Cannot iterate over null (null)
jq: error (at :1): Cannot iterate over null (null)
jq: error (at :1): Cannot iterate over null (null)
jq: error (at :1): Cannot iterate over null (null)
jq: error (at :1): Cannot iterate over null (null)
jq: error (at :1): Cannot iterate over null (null)
jq: error (at :1): Cannot iterate over null (null)
jq: error (at :1): Cannot iterate over null (null)
[root@monitor ~]#
Hello,
Using jq 1.6 as well, I am wondering if might be on the auth? What format are you using? I am using
veeamUsername=”jorgedelacruz\administrator”
Best regards
Hello,
1, the Enteprise Manager -> this was the auth issue. i changed the username to local user (from domain\username) to just (user) and it works. However, once again i’m getting incomplete data for certain queries….
jq: error (at :1): Cannot iterate over null (null)
Writing veeam_em_nas_jobs to InfluxDB
HTTP/1.1 400 Bad Request
Content-Type: application/json
Request-Id: bc131de4-d260-11eb-83e2-005056ab4039
X-Influxdb-Build: OSS
X-Influxdb-Error: unable to parse ‘veeam_em_nas_jobs,veeamNASJobName=sophia_daily_backup_of_configs,veeamVBR=deimos,veeamNASJobPath=agora:/vmware_backup,veeamNASJobExclusions=,veeamNASJobShortTermType=Month veeamNASJobShortTerm=3’: missing tag value
X-Influxdb-Version: 1.8.6
X-Request-Id: bc131de4-d260-11eb-83e2-005056ab4039
Date: Mon, 21 Jun 2021 07:17:27 GMT
Content-Length: 244
{“error”:”unable to parse ‘veeam_em_nas_jobs,veeamNASJobName=sophia_daily_backup_of_configs,veeamVBR=deimos,veeamNASJobPath=agora:/vmware_backup,veeamNASJobExclusions=,veeamNASJobShortTermType=Month veeamNASJobShortTerm=3’: missing tag value”}
Writing veeam_em_nas_sessions to InfluxDB
HTTP/1.1 204 No Content
Content-Type: application/json
Request-Id: bc4428a8-d260-11eb-83e3-005056ab4039
X-Influxdb-Build: OSS
X-Influxdb-Version: 1.8.6
X-Request-Id: bc4428a8-d260-11eb-83e3-005056ab4039
Date: Mon, 21 Jun 2021 07:17:28 GMT
2, VeemOne issue -> i looked at the web client and stats (tiles) are empty in “Veeam Backup and Replication” Dashboard. I will open ticket with Veeam about this -> its most likely the same issue.
I never used web client before – always use the C++ client and statistics/information there is fully populated.
Thank you – i will report back once i have feedback from Veeam.
Thank you for letting me know, it seems that I need to add some extra parsing if you have no exclusions on the NAS Jobs 🙂
Regarding VONE, yes, you should have data on the VONE Web Client Dashboard first 🙂
Hello,
so we had a Veeam support look at our install and apparently there was an issue with v10 -> v11
They fixed our install and all is now working in Enterprise Manager as well as VONE Web Client.
However there are still parsing issues – not sure if you’re interested or not – i’ll post them – let me know and i’ll stop 🙂
I havent had time to dig into it, but it looks like the calls are getting (valid) responses but the responses contain some tags/values that weren’t expected.
Thanks !
1, Enterprise manager:
jq: error (at :1): Cannot iterate over null (null)
Writing veeam_em_nas_jobs to InfluxDB
HTTP/1.1 400 Bad Request
Content-Type: application/json
Request-Id: 79ab2e78-d2aa-11eb-847c-005056ab4039
X-Influxdb-Build: OSS
X-Influxdb-Error: unable to parse ‘veeam_em_nas_jobs,veeamNASJobName=sophia_daily_backup_of_configs,veeamVBR=deimos,veeamNASJobPath=agora:/vmware_backup,veeamNASJobExclusions=,veeamNASJobShortTermType=Month veeamNASJobShortTerm=3’: missing tag value
X-Influxdb-Version: 1.8.6
X-Request-Id: 79ab2e78-d2aa-11eb-847c-005056ab4039
Date: Mon, 21 Jun 2021 16:05:19 GMT
Content-Length: 244
{“error”:”unable to parse ‘veeam_em_nas_jobs,veeamNASJobName=sophia_daily_backup_of_configs,veeamVBR=deimos,veeamNASJobPath=agora:/vmware_backup,veeamNASJobExclusions=,veeamNASJobShortTermType=Month veeamNASJobShortTerm=3’: missing tag value”}
Writing veeam_em_nas_sessions to InfluxDB
HTTP/1.1 204 No Content
Content-Type: application/json
Request-Id: 79dc5db4-d2aa-11eb-847d-005056ab4039
X-Influxdb-Build: OSS
X-Influxdb-Version: 1.8.6
X-Request-Id: 79dc5db4-d2aa-11eb-847d-005056ab4039
Date: Mon, 21 Jun 2021 16:05:19 GMT
2, Veeam One
Writing veeam_ONE_protectedvms to InfluxDB
HTTP/1.1 400 Bad Request
Content-Type: application/json
Request-Id: aa3cc391-d2aa-11eb-8487-005056ab4039
X-Influxdb-Build: OSS
X-Influxdb-Error: unable to parse ‘veeam_ONE_protectedvms,voneserver=deimos protectedvms=19,backuedupvms=19,replicatedvms=0,unprotectedvms=8,restorepoints=3025,fullbackups=1043712.00,increments=,sourcevmsize=91121254.40,successratio=100’: missing field value
X-Influxdb-Version: 1.8.6
X-Request-Id: aa3cc391-d2aa-11eb-8487-005056ab4039
Date: Mon, 21 Jun 2021 16:06:40 GMT
Content-Length: 253
{“error”:”unable to parse ‘veeam_ONE_protectedvms,voneserver=deimos protectedvms=19,backuedupvms=19,replicatedvms=0,unprotectedvms=8,restorepoints=3025,fullbackups=1043712.00,increments=,sourcevmsize=91121254.40,successratio=100’: missing field value”}
Writing veeam_ONE_backupinfrastructure to InfluxDB
HTTP/1.1 400 Bad Request
Content-Type: application/json
Request-Id: aa6c6f7e-d2aa-11eb-8488-005056ab4039
X-Influxdb-Build: OSS
X-Influxdb-Error: unable to parse ‘veeam_ONE_backupinfrastructure,voneserver=deimos totalvbr=1,totalproxy=2,totalrepo=2,totalbackupjob=1,totalreplicajob=1,totalbackupcopyjob=,totalnasjob=,totalcdpolicy=’: missing field value
X-Influxdb-Version: 1.8.6
X-Request-Id: aa6c6f7e-d2aa-11eb-8488-005056ab4039
Date: Mon, 21 Jun 2021 16:06:41 GMT
Content-Length: 219
{“error”:”unable to parse ‘veeam_ONE_backupinfrastructure,voneserver=deimos totalvbr=1,totalproxy=2,totalrepo=2,totalbackupjob=1,totalreplicajob=1,totalbackupcopyjob=,totalnasjob=,totalcdpolicy=’: missing field value”}
Writing veeam_ONE_jobs to InfluxDB
HTTP/1.1 204 No Content
Content-Type: application/json
Request-Id: aa9176b1-d2aa-11eb-8489-005056ab4039
X-Influxdb-Build: OSS
X-Influxdb-Version: 1.8.6
X-Request-Id: aa9176b1-d2aa-11eb-8489-005056ab4039
Date: Mon, 21 Jun 2021 16:06:41 GMT
Writing veeam_ONE_jobsduration to InfluxDB
HTTP/1.1 400 Bad Request
Content-Type: application/json
Request-Id: ab12e281-d2aa-11eb-8490-005056ab4039
X-Influxdb-Build: OSS
X-Influxdb-Error: unable to parse ‘veeam_ONE_jobsduration,voneserver=deimos,jobname=sophia_daily_backup_of_vms(copy),jobstatus=,jobduration=227 trend=0 1624285124’: missing tag value
X-Influxdb-Version: 1.8.6
X-Request-Id: ab12e281-d2aa-11eb-8490-005056ab4039
Date: Mon, 21 Jun 2021 16:06:42 GMT
Content-Length: 177
{“error”:”unable to parse ‘veeam_ONE_jobsduration,voneserver=deimos,jobname=sophia_daily_backup_of_vms(copy),jobstatus=,jobduration=227 trend=0 1624285124’: missing tag value”}
Writing veeam_ONE_jobsduration to InfluxDB
HTTP/1.1 204 No Content
Content-Type: application/json
Request-Id: ab249ef7-d2aa-11eb-8491-005056ab4039
X-Influxdb-Build: OSS
X-Influxdb-Version: 1.8.6
X-Request-Id: ab249ef7-d2aa-11eb-8491-005056ab4039
Date: Mon, 21 Jun 2021 16:06:42 GMT
Hello,
Good to know, you should have a ton of data anyways already, I can see now that there are a few stuff I can fix, will add the checks, push the script and let you know.
Best regards
Hello! Jorge, I’m facing the same problem, could you help me?
{“code”:”unauthorized”,”message”:”Unauthorized”}Writing veeam_ONE_backupinfrastructure to InfluxDB
HTTP/1.1 401 Unauthorized
Content-Type: application/json; charset=utf-8
X-Influxdb-Build: OSS
X-Influxdb-Version: v2.6.1
X-Platform-Error-Code: unauthorized
Date: Mon, 20 Mar 2023 18:23:05 GMT
Content-Length: 48
{“code”:”unauthorized”,”message”:”Unauthorized”}[root@sta-margarida influxdb]# chmod +x veeam_one.sh
[root@sta-margarida influxdb]# ./veeam_one.sh
Writing veeam_ONE_about to InfluxDB
HTTP/1.1 400 Bad Request
Content-Type: application/json
Request-Id: 76834df6-c74d-11ed-90bb-005056b9ea76
X-Influxdb-Build: OSS
X-Influxdb-Error: unable to parse ‘veeam_ONE_about,voneserver=,voneversion= vone=1’: missing tag value
X-Influxdb-Version: 1.8.10
X-Request-Id: 76834df6-c74d-11ed-90bb-005056b9ea76
Date: Mon, 20 Mar 2023 18:31:43 GMT
Content-Length: 97
{“error”:”unable to parse ‘veeam_ONE_about,voneserver=,voneversion= vone=1’: missing tag value”}
Writing veeam_ONE_protectedvms to InfluxDB
HTTP/1.1 400 Bad Request
Content-Type: application/json
Request-Id: 7696a580-c74d-11ed-90bc-005056b9ea76
X-Influxdb-Build: OSS
X-Influxdb-Error: unable to parse ‘veeam_ONE_protectedvms,voneserver= protectedvms=,backuedupvms=,replicatedvms=,unprotectedvms=,restorepoints=,fullbackups=,increments=,sourcevmsize=,successratio=’: missing tag value
X-Influxdb-Version: 1.8.10
X-Request-Id: 7696a580-c74d-11ed-90bc-005056b9ea76
Date: Mon, 20 Mar 2023 18:31:43 GMT
Content-Length: 211
{“error”:”unable to parse ‘veeam_ONE_protectedvms,voneserver= protectedvms=,backuedupvms=,replicatedvms=,unprotectedvms=,restorepoints=,fullbackups=,increments=,sourcevmsize=,successratio=’: missing tag value”}
Writing veeam_ONE_backupinfrastructure to InfluxDB
HTTP/1.1 400 Bad Request
Content-Type: application/json
Request-Id: 76a09999-c74d-11ed-90bd-005056b9ea76
X-Influxdb-Build: OSS
X-Influxdb-Error: unable to parse ‘veeam_ONE_backupinfrastructure,voneserver= totalvbr=,totalproxy=,totalrepo=,totalbackupjob=,totalreplicajob=,totalbackupcopyjob=,totalnasjob=,totalcdpolicy=’: missing tag value
X-Influxdb-Version: 1.8.10
X-Request-Id: 76a09999-c74d-11ed-90bd-005056b9ea76
Date: Mon, 20 Mar 2023 18:31:43 GMT
Content-Length: 206
Hola,
Que version de Veeam ONE usas, v11? v12? Y que edicion?
Saludos
Hello Jorge,
I’m facing similar errors, I’m using veeam one and 12.0.1.2591
jq: error (at :1): Cannot index array with string “name”
jq: error (at :1): Cannot iterate over null (null)
jq: error (at :1): Cannot iterate over null (null)
jq: error (at :1): Cannot iterate over null (null)
jq: error (at :1): Cannot iterate over null (null)
jq: error (at :1): Cannot iterate over null (null)
jq: error (at :1): Cannot iterate over null (null)
Writing veeam_ONE_about to InfluxDB
HTTP/1.1 204 No Content
Content-Type: application/json
Request-Id: 4002c7dd-3c2f-11ee-b270-005056be56a1
X-Influxdb-Build: OSS
X-Influxdb-Version: 1.8.10
X-Request-Id: 4002c7dd-3c2f-11ee-b270-005056be56a1
Date: Wed, 16 Aug 2023 12:20:13 GMT
Writing veeam_ONE_protectedvms to InfluxDB
HTTP/1.1 400 Bad Request
Content-Type: application/json
Request-Id: 4029b5c5-3c2f-11ee-b271-005056be56a1
X-Influxdb-Build: OSS
X-Influxdb-Error: unable to parse ‘veeam_ONE_protectedvms,voneserver=vone.ggdc.local protectedvms=,backuedupvms=,replicatedvms=,unprotectedvms=,restorepoints=,fullbackups=,increments=,sourcevmsize=,successratio=’: missing field value
X-Influxdb-Version: 1.8.10
X-Request-Id: 4029b5c5-3c2f-11ee-b271-005056be56a1
Date: Wed, 16 Aug 2023 12:20:13 GMT
Content-Length: 228
{“error”:”unable to parse ‘veeam_ONE_protectedvms,voneserver=vone.ggdc.local protectedvms=,backuedupvms=,replicatedvms=,unprotectedvms=,restorepoints=,fullbackups=,increments=,sourcevmsize=,successratio=’: missing field value”}
Writing veeam_ONE_backupinfrastructure to InfluxDB
HTTP/1.1 400 Bad Request
Content-Type: application/json
Request-Id: 4042ceba-3c2f-11ee-b272-005056be56a1
X-Influxdb-Build: OSS
X-Influxdb-Error: unable to parse ‘veeam_ONE_backupinfrastructure,voneserver=vone.ggdc.local totalvbr=,totalproxy=,totalrepo=,totalbackupjob=,totalreplicajob=,totalbackupcopyjob=,totalnasjob=,totalcdpolicy=’: missing field value
X-Influxdb-Version: 1.8.10
X-Request-Id: 4042ceba-3c2f-11ee-b272-005056be56a1
Date: Wed, 16 Aug 2023 12:20:13 GMT
Content-Length: 223
{“error”:”unable to parse ‘veeam_ONE_backupinfrastructure,voneserver=vone.ggdc.local totalvbr=,totalproxy=,totalrepo=,totalbackupjob=,totalreplicajob=,totalbackupcopyjob=,totalnasjob=,totalcdpolicy=’: missing field value”}
Hello,
Will take a look and let you know soon mate.
Thanks